The Waste Reduction KPI Dashboard in Excel is a ready-to-use and fully automated template designed to help businesses track, analyze, and optimize their waste management efforts. This dynamic dashboard provides real-time insights into key performance indicators (KPIs), enabling data-driven decision-making for sustainability and operational efficiency.
Key Features:
Home Sheet
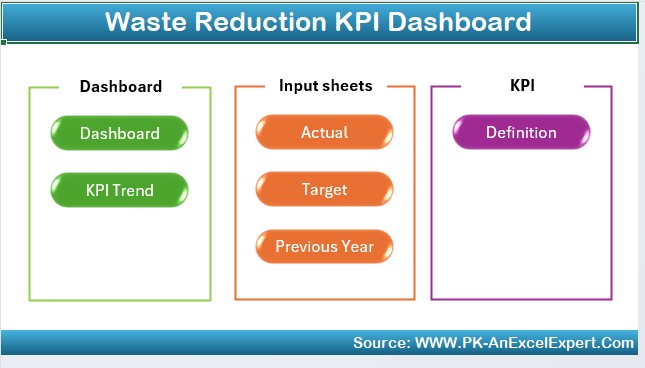
- An index sheet with quick navigation buttons for seamless access to different sections.
Dashboard Sheet
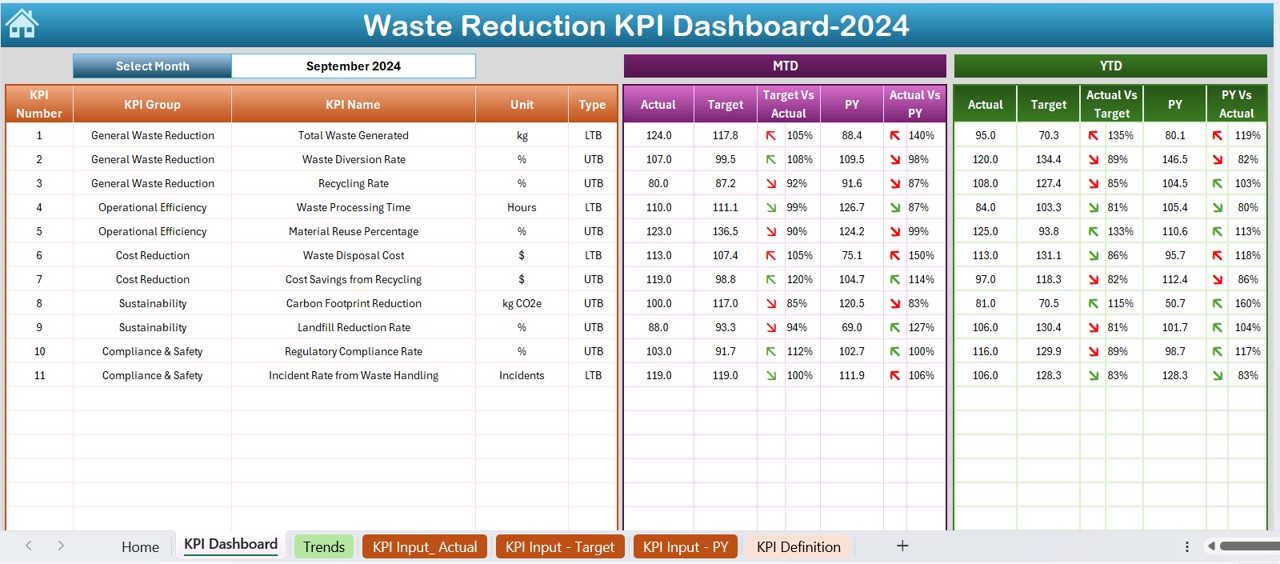
- A comprehensive visual dashboard displaying MTD and YTD actual vs. target values with conditional formatting.
KPI Trend Sheet
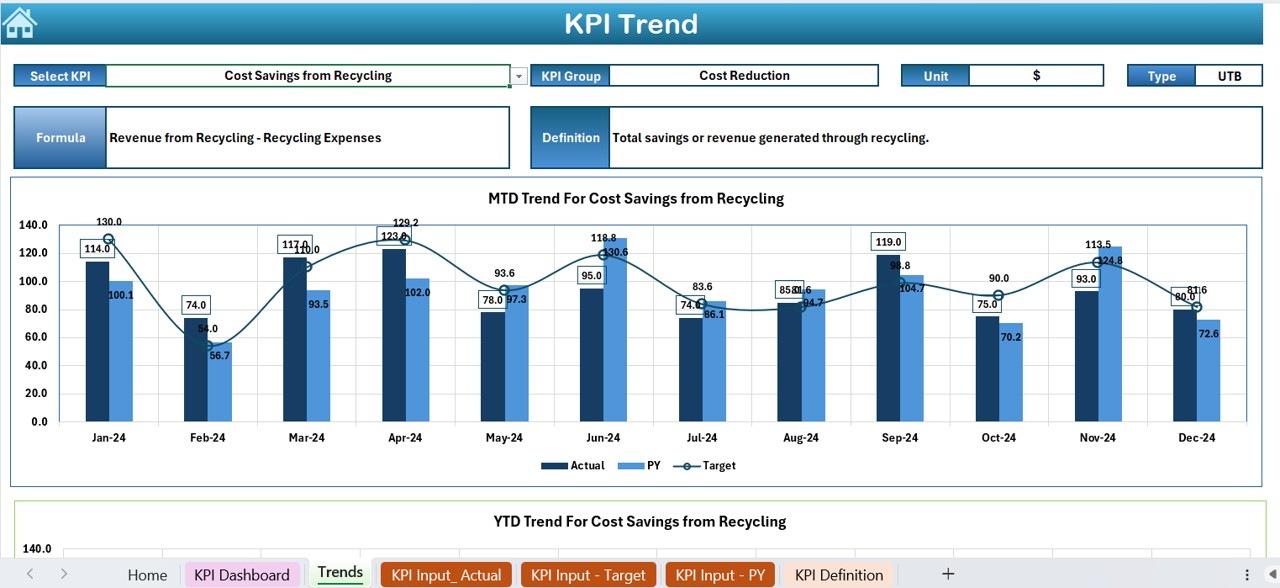
- Enables trend analysis with MTD and YTD comparisons, allowing users to monitor KPI performance effectively.
Actual Numbers Input Sheet
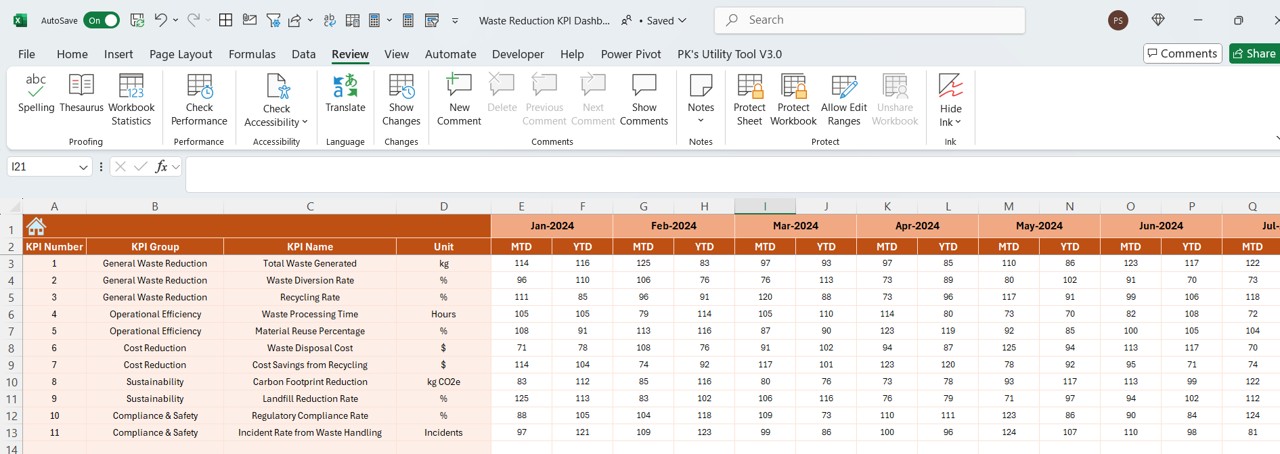
- Allows users to input actual KPI values for MTD and YTD, with a dynamic month selection option.
Target Sheet
- A structured sheet to set KPI targets for both monthly and yearly tracking.
Previous Year Data Sheet
- Stores historical KPI data for easy year-over-year comparison.
KPI Definition Sheet
- Contains detailed KPI descriptions, formulas, and classifications for precise data interpretation.