The Wealth Management KPI Dashboard in Excel is a ready-to-use template designed to help financial professionals and investors track key performance indicators (KPIs) effortlessly. This interactive dashboard provides real-time insights into financial performance, allowing users to make informed decisions for wealth optimization.
Key Features:
Home Sheet
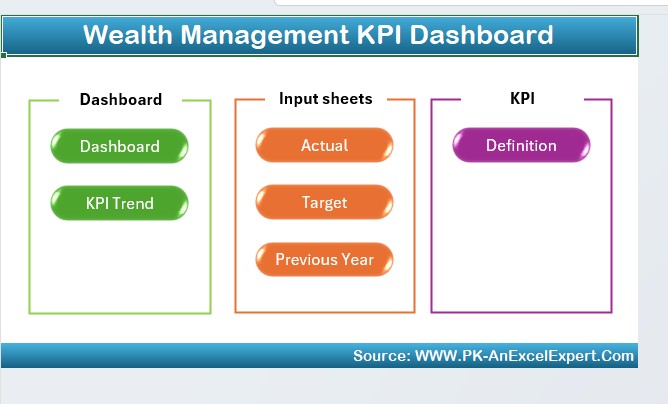
Acts as an index page with 6 quick-access buttons for seamless navigation.
Dashboard Sheet
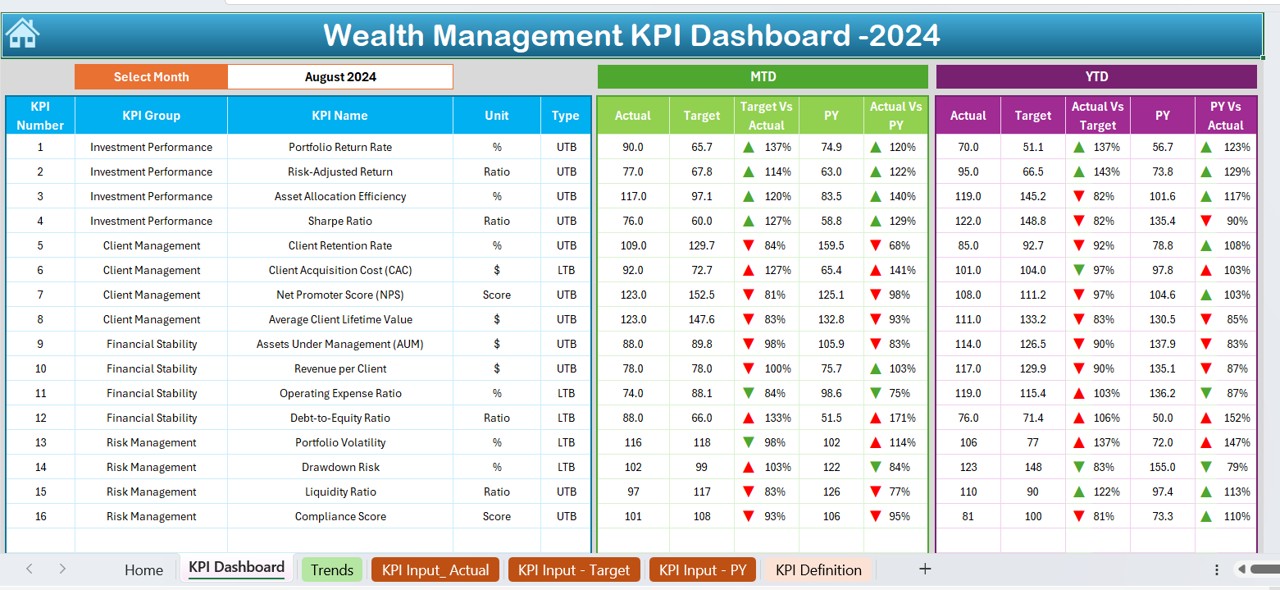
Displays MTD and YTD data dynamically with conditional formatting for Target vs. Actual and Previous Year comparisons.
KPI Trend Sheet
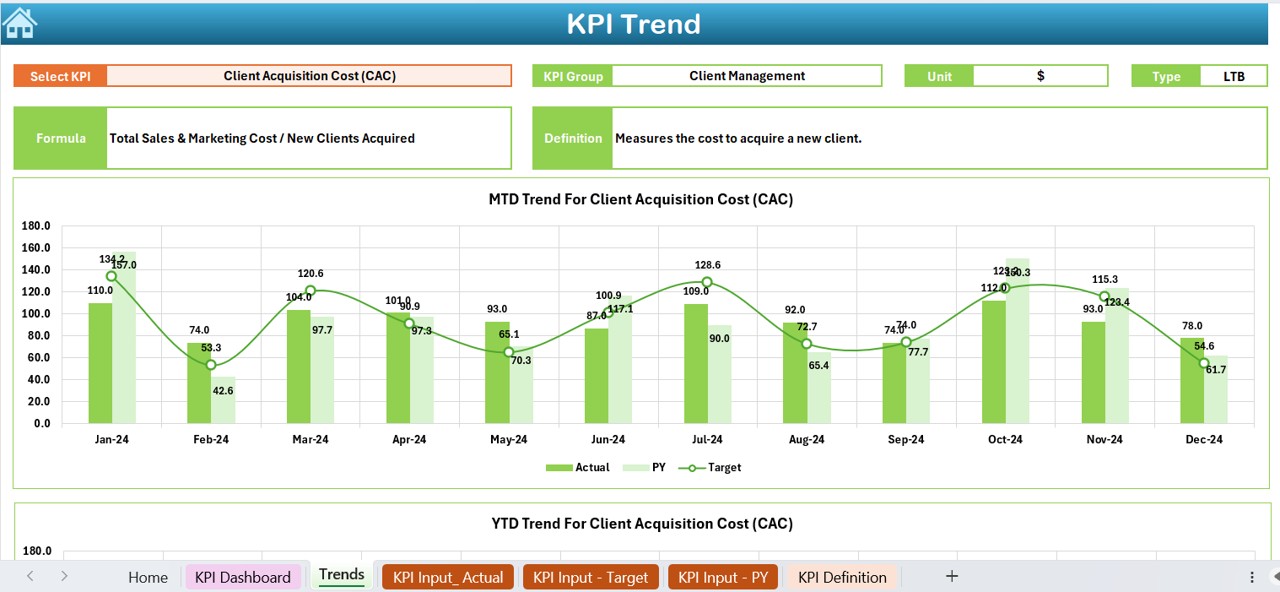
Enables selection of KPIs via dropdown, showcasing unit, type, formula, and trend charts for actual vs. target values.
Actual Numbers Input Sheet
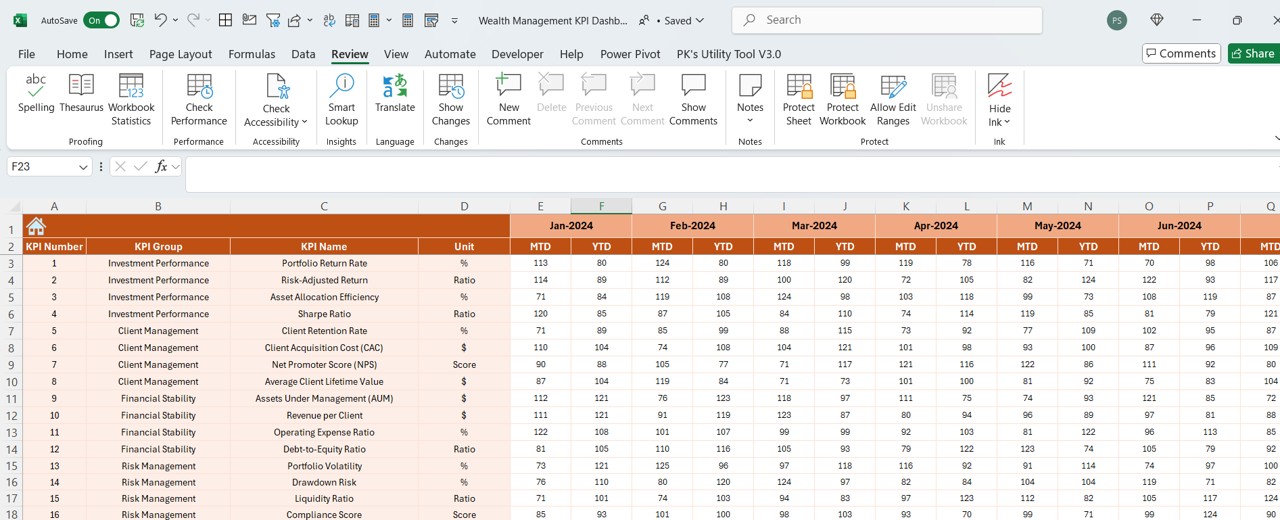
Allows manual entry of financial figures for accurate MTD and YTD tracking with a dynamic month selection.
Target Sheet
Facilitates the entry of KPI targets on a monthly and yearly basis for better financial planning.
Previous Year Number Sheet
Stores historical financial data to enable year-on-year comparisons and performance analysis.
KPI Definition Sheet
Maintains a structured list of KPI names, categories, formulas, and definitions for clarity and standardization.