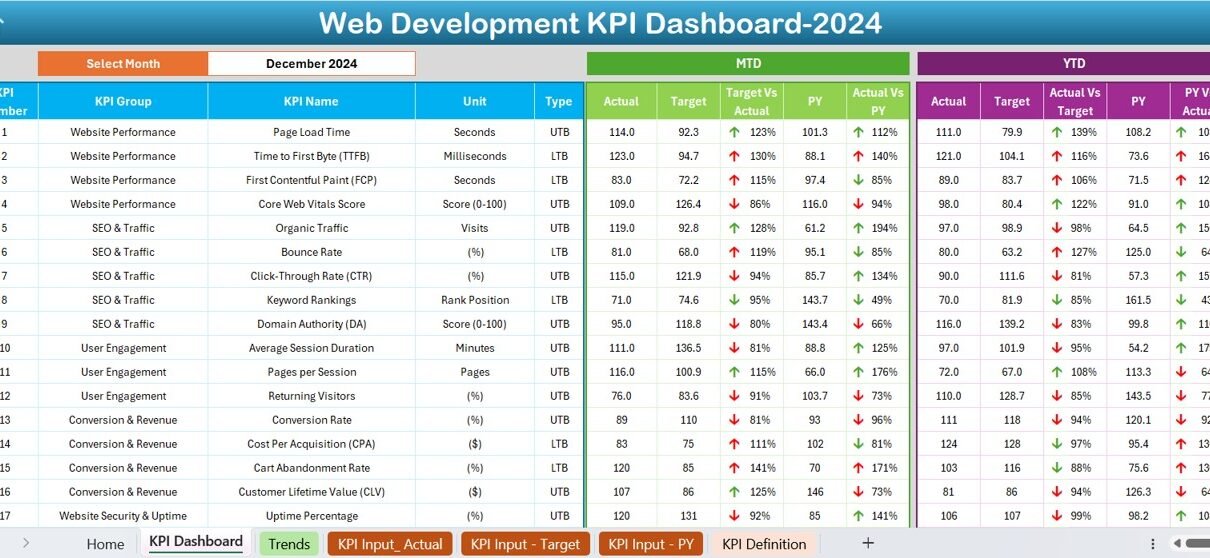
The Web Development KPI Dashboard in Excel is a powerful and ready-to-use template designed to help web development teams track, analyze, and optimize their performance. This dynamic dashboard provides real-time insights into essential KPIs, enabling data-driven decision-making for better project efficiency and success. With interactive features, automated calculations, and visually appealing reports, it simplifies performance monitoring and enhances productivity.
Key Features of the Web Development KPI Dashboard in Excel
Home Sheet:
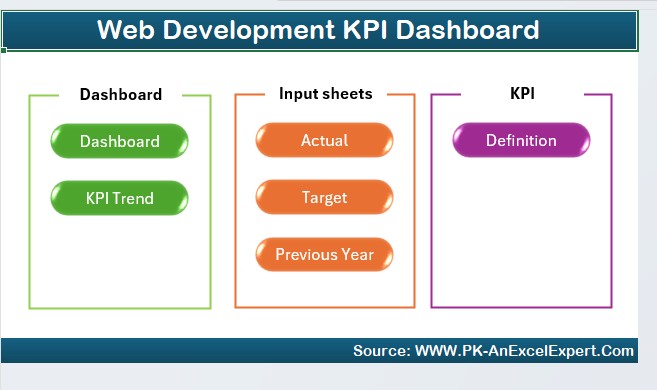
Quick navigation with six interactive buttons for easy access to all sheets.
Dashboard Sheet:
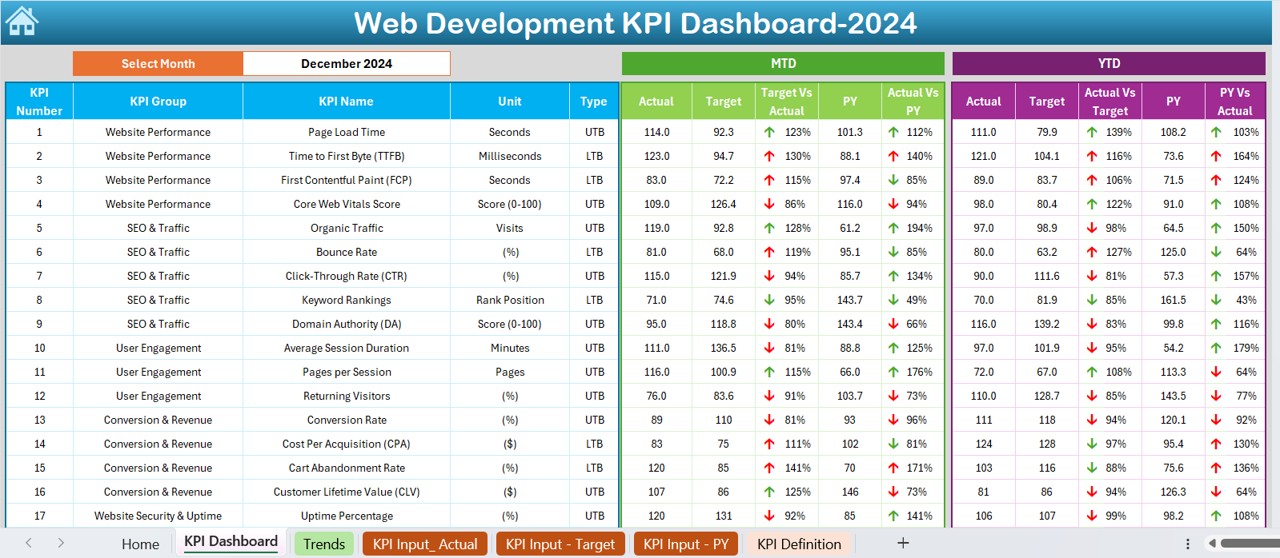
A comprehensive KPI view with MTD and YTD comparisons, trend indicators, and drop-down selection for months.
KPI Trend Sheet:
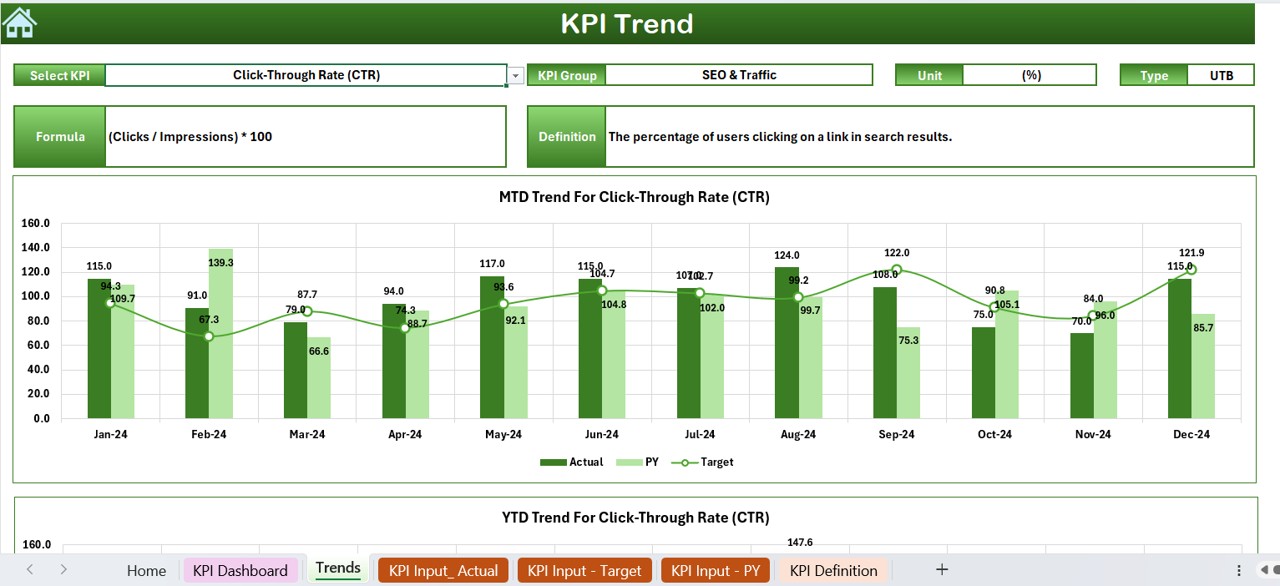
Analyze individual KPI performance trends with MTD and YTD trend charts and formula breakdowns.
Actual Numbers Input Sheet:
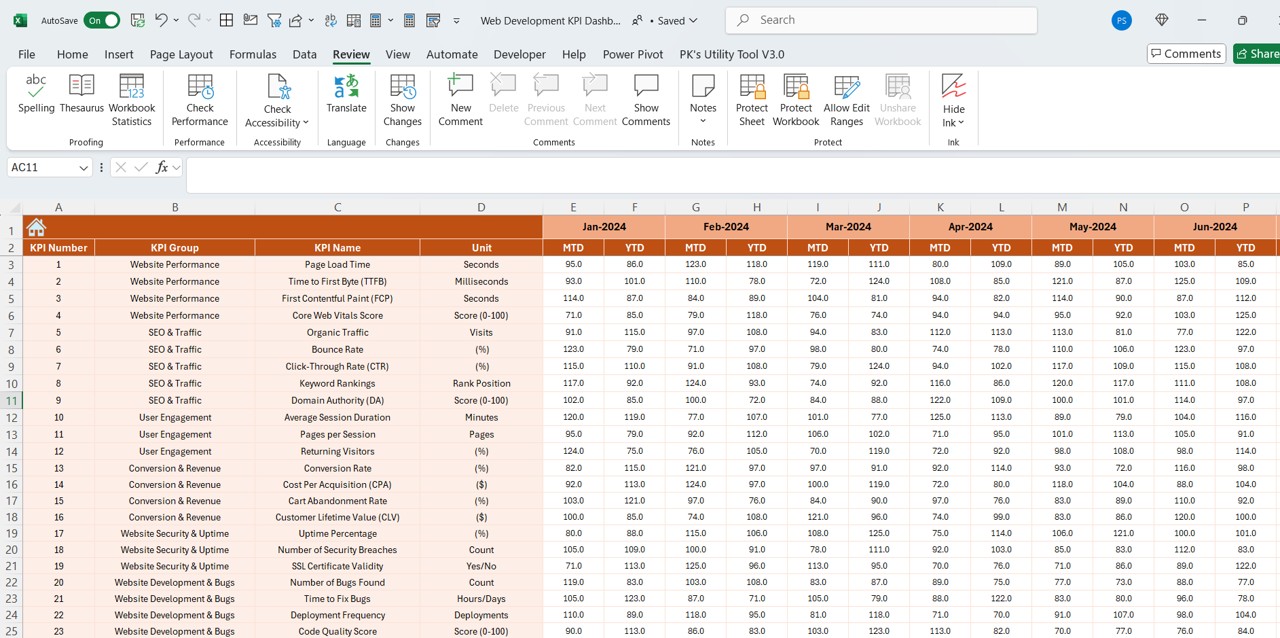
Enter monthly and yearly actual performance data effortlessly.
Target Sheet:
Define and track monthly and yearly KPI targets for goal alignment.
Previous Year Data Sheet:
Compare current performance with historical data for accurate benchmarking.
KPI Definition Sheet:
Maintain a structured reference of KPI names, groups, units, formulas, and definitions for clarity and consistency.