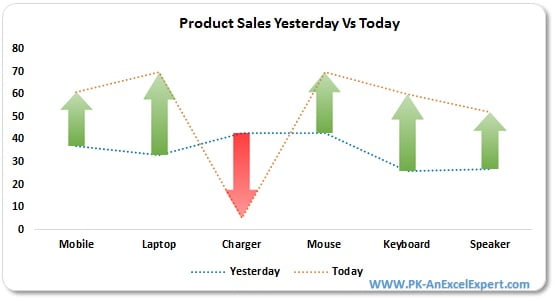
Home>Download>Yesterday Vs Today Sales Chart
Yesterday Vs Today Sales Chart

Yesterday Vs Today Sales Chart

Yesterday Vs Today Sales Chart: Visualizing Sales Trends

In this article, you will learn how to effectively compare the sales of different products for yesterday versus today using our innovative “Yesterday Vs Today Sales Chart.” This powerful tool is designed to provide a clear and immediate visual representation of sales performance.

Our chart displays green and red arrows to indicate changes in sales:

Green Arrow: Indicates that today’s sales are higher than yesterday’s.
Red Arrow: Indicates that today’s sales are lower than yesterday’s.
With this intuitive visual aid, you can quickly assess sales trends and make informed decisions to optimize your business strategies. Join us as we guide you through the process of leveraging this chart to gain valuable insights into your daily sales performance.

PK
Meet PK, the founder of PK-AnExcelExpert.com! With over 15 years of experience in Data Visualization, Excel Automation, and dashboard creation. PK is a Microsoft Certified Professional who has a passion for all things in Excel. PK loves to explore new and innovative ways to use Excel and is always eager to share his knowledge with others. With an eye for detail and a commitment to excellence, PK has become a go-to expert in the world of Excel. Whether you're looking to create stunning visualizations or streamline your workflow with automation, PK has the skills and expertise to help you succeed. Join the many satisfied clients who have benefited from PK's services and see how he can take your Excel skills to the next level!
https://www.pk-anexcelexpert.com