The E-sports industry has grown exponentially in the last decade, with millions of fans and players around the globe. However, the rapid expansion of E-sports has led to a new challenge: how to manage and monitor player and team performance efficiently. One of the best ways to do so is through the use of Key Performance Indicators (KPIs), and this is where the E-sports KPI Dashboard in Power BI comes in.
This article will explore the concept of an E-sports KPI dashboard, its key features, and how Power BI can help teams and organizations in the gaming industry track and optimize performance. We’ll dive deep into the features of the dashboard, the KPIs you should be tracking, and the benefits of using Power BI for your E-sports performance management.
What is an E-sports KPI Dashboard in Power BI?
An E-sports KPI Dashboard in Power BI is a powerful data visualization tool that allows E-sports organizations, teams, and players to track their performance across various metrics. Power BI, a business analytics service by Microsoft, integrates with multiple data sources to provide real-time reporting and insightful visualizations.
In the context of E-sports, the dashboard tracks KPIs such as the win rate, kills/deaths ratio, total playtime, and more. By using this dashboard, E-sports organizations can monitor team performance, set realistic targets, and make data-driven decisions to enhance their game strategies and player skills.
Why Use a KPI Dashboard for E-sports?
The use of KPIs in E-sports is essential for several reasons:
-
Data-Driven Decision Making: KPIs allow organizations to track key metrics that influence their strategies. This makes it easier to evaluate team and player performance, identify areas of improvement, and make data-driven decisions.
-
Performance Monitoring: Whether it’s tracking a player’s win rate or a team’s overall performance, a KPI dashboard helps monitor critical data that may impact the results of matches and tournaments.
-
Setting and Achieving Goals: With clear KPI targets set, teams and players can track their progress, ensuring they are moving toward their goals. This motivates individuals and teams to perform better.
-
Identifying Strengths and Weaknesses: By reviewing the data, organizations can pinpoint which areas need improvement, be it gameplay tactics, strategy, or player health and wellness.
Key Features of the E-sports KPI Dashboard in Power BI
A good E-sports KPI Dashboard in Power BI is more than just a set of numbers and charts. It’s a tool that provides valuable insights and visualizations. Below are the key features of the E-sports KPI Dashboard that will help optimize your game performance:
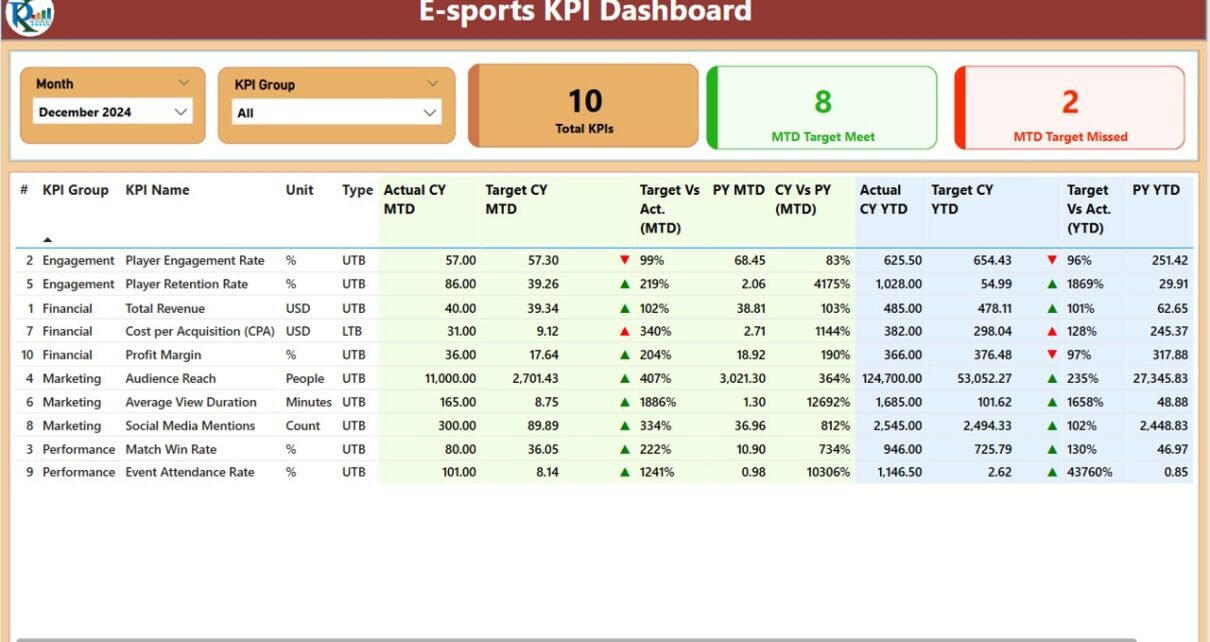
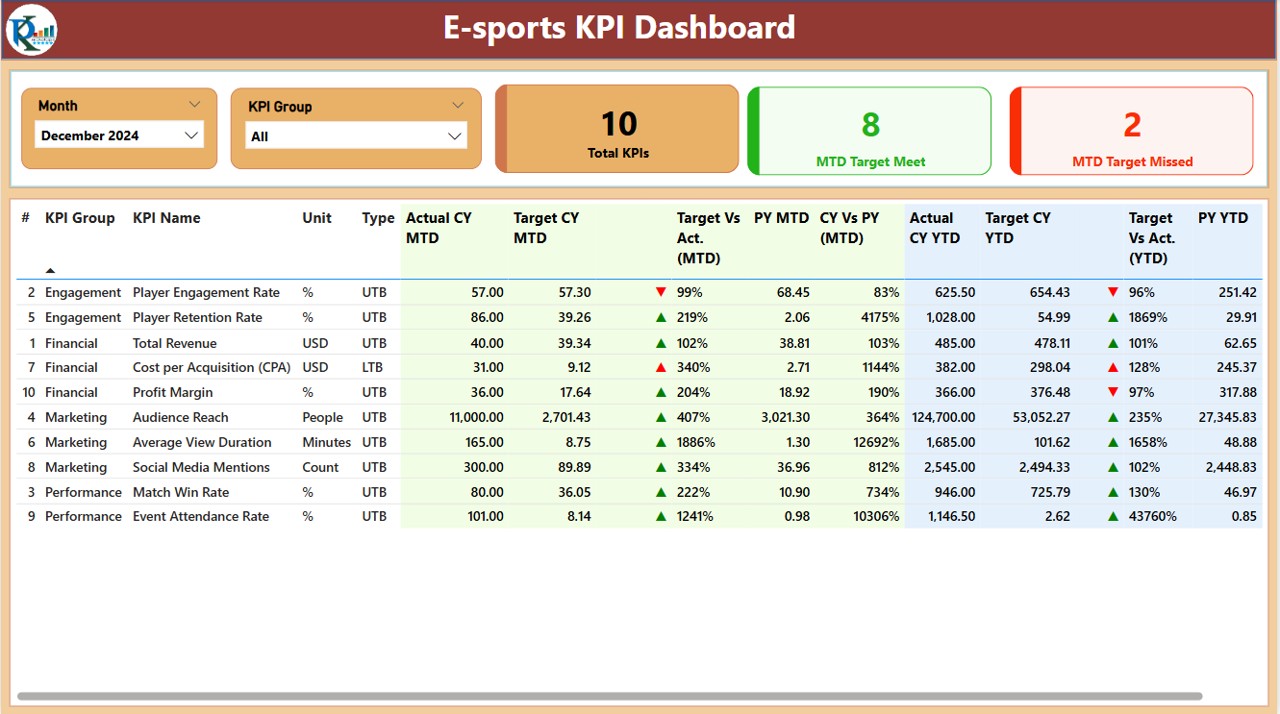
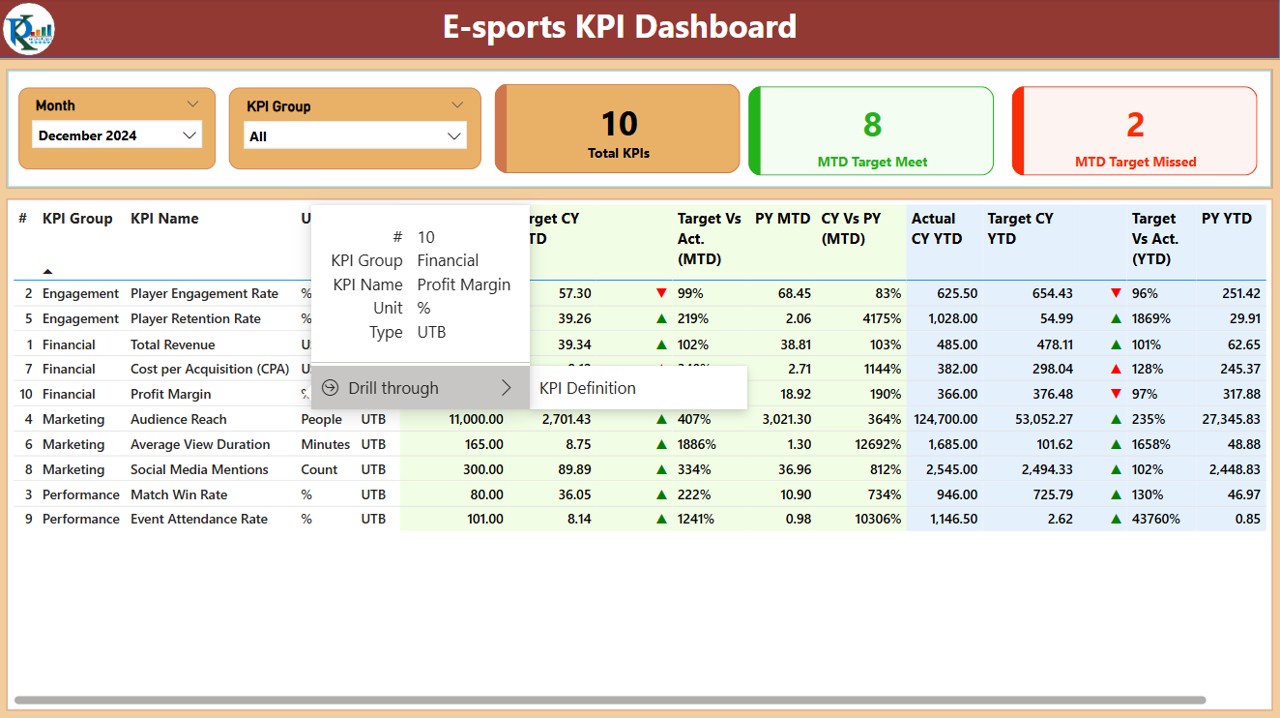
1. Summary Page
The Summary Page is the main page of the E-sports KPI Dashboard. It’s where you get an overall view of your team’s performance.
-
KPI Group and Month Slicer: At the top of the page, you can use slicers to select the month and KPI group, enabling you to view relevant data for the time period and category you’re interested in.
Total KPIs Count: This card displays the total number of KPIs being tracked for your E-sports team or player.
MTD Target Meet and Target Missed Count: These cards show how many KPIs met their monthly targets and how many missed them, helping you gauge whether you are on track for the month.
KPI Details Table: Below the cards, there’s a detailed table displaying information about each KPI. This includes:
- KPI Number: A sequence number for easy identification.
- KPI Group: The category the KPI falls under (e.g., performance, health, strategy).
- KPI Name: The name of the KPI.
- Unit: The unit of measurement for each KPI (e.g., percentage, ratio).
- Type: The type of KPI (either LTB – Lower the Better or UTB – Upper the Better).
- Actual CY MTD: The actual value for the current year’s month-to-date (MTD) performance.
- Target CY MTD: The target value for the current year’s MTD.
- MTD Icon: Color-coded up (▲) and down (▼) arrows indicating whether the KPI met the target for MTD.
- Target vs Actual (MTD): The percentage comparison between the target and actual value for MTD.
- PY MTD: The same KPI data from the previous year for MTD.
- CY vs PY (MTD): The percentage comparison of the current year’s MTD vs the previous year’s MTD.
YTD Data: Similar to MTD, the YTD (Year-To-Date) data section includes the same information for the entire year. It helps track long-term progress and trends.
Click to buy E-sports KPI Dashboard in Power BI
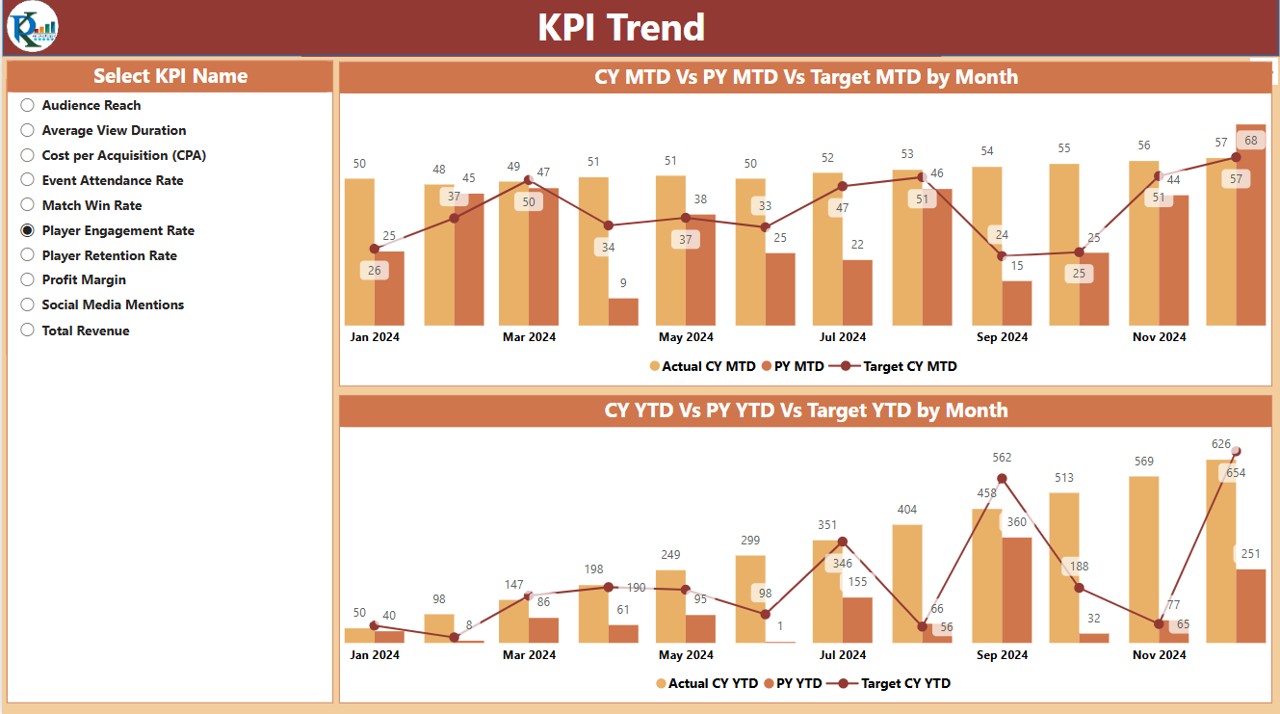
2. KPI Trend Page
The KPI Trend Page is where you can visualize the historical data for each KPI. It includes:
-
Combo Charts: Two combo charts are displayed to compare the actual numbers for the current year, previous year, and targets for both MTD and YTD.
-
KPI Selection Slicer: On the left side, you can select which KPI you want to focus on, and the charts will update accordingly. This allows for a more detailed analysis of each KPI over time.
Click to buy E-sports KPI Dashboard in Power BI
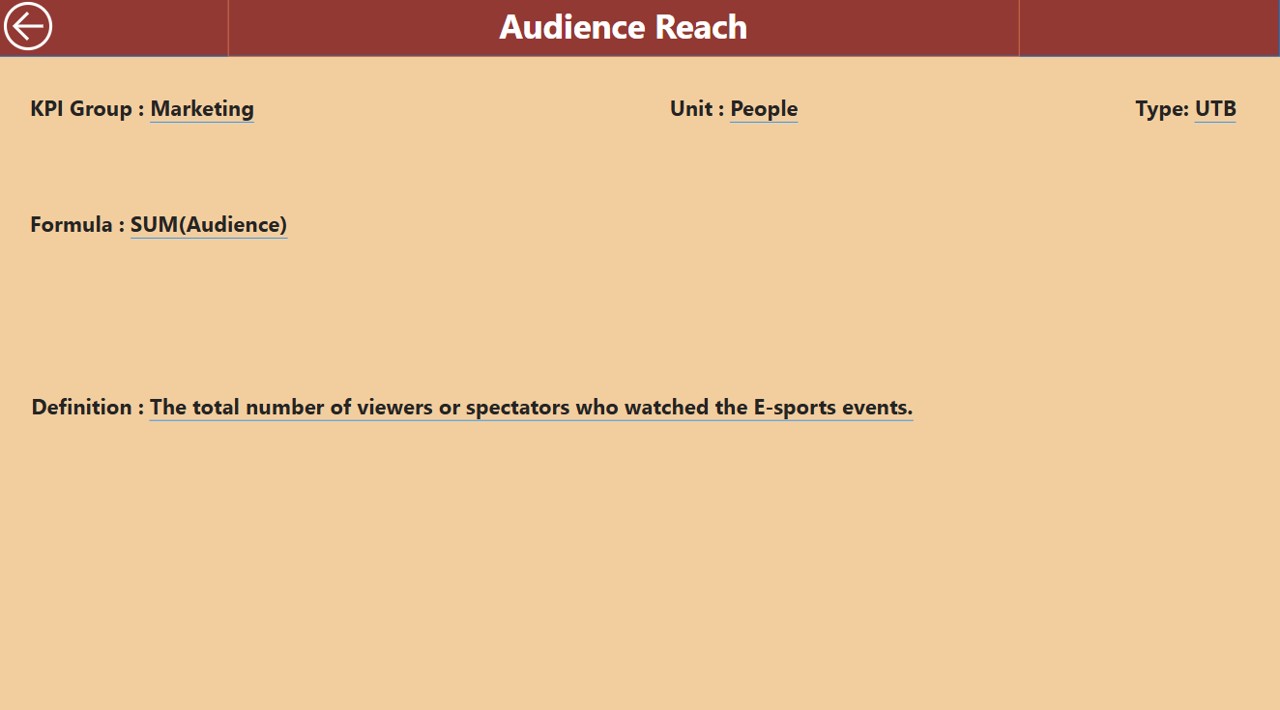
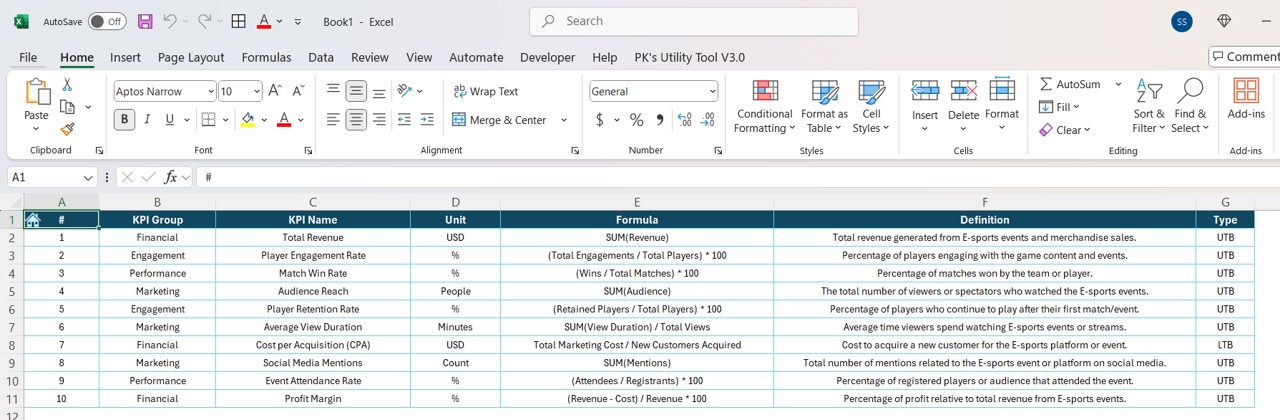
3. KPI Definition Page
The KPI Definition Page is hidden and accessible via a drill-through from the Summary Page. Here you can see detailed information about each KPI, such as:
Click to buy E-sports KPI Dashboard in Power BI
- Formula: The formula used to calculate the KPI.
- Definition: A short description explaining the significance of the KPI.
Click to buy E-sports KPI Dashboard in Power BI
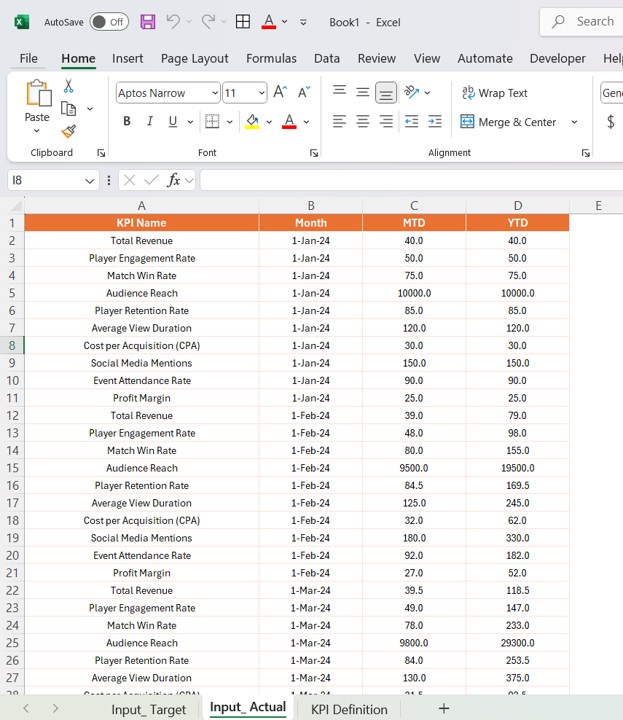
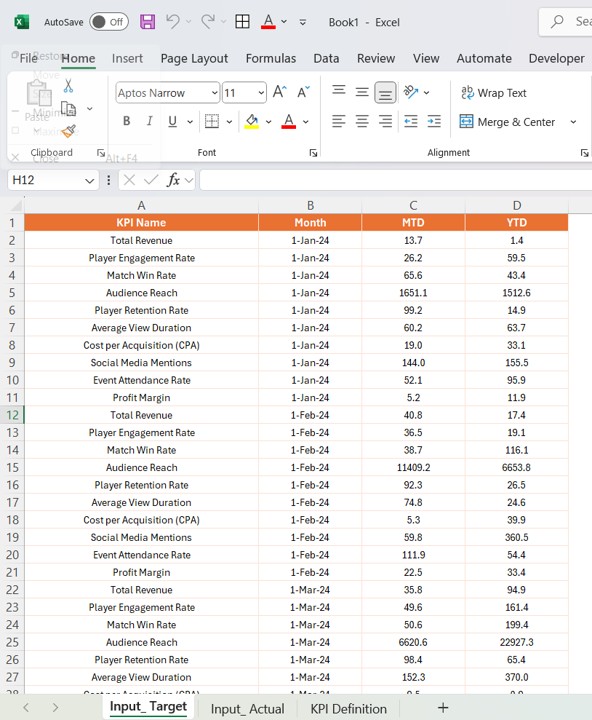
Excel Data Integration
This dashboard uses an Excel file as the data source. The following three worksheets are key to managing the data:
- Input_Actual Sheet: This is where the actual values for each KPI, month, MTD, and YTD are inputted.
Click to buy E-sports KPI Dashboard in Power BI
- Input_Target Sheet: This is where the target values for each KPI, month, MTD, and YTD are entered.
Click to buy E-sports KPI Dashboard in Power BI
- KPI Definition Sheet: This sheet stores information such as the KPI number, group, name, unit, formula, and type (LTB or UTB).
Click to buy E-sports KPI Dashboard in Power BI
Advantages of the E-sports KPI Dashboard in Power BI
Implementing the E-sports KPI Dashboard in Power BI brings several benefits to both teams and organizations:
- Real-Time Performance Tracking: The dashboard provides real-time insights into how well your players or teams are performing.
- Comprehensive Data Analysis: With the ability to track various KPIs, such as win rates and player stats, the dashboard helps identify trends and areas for improvement.
- Visual Clarity: Power BI’s intuitive design ensures that all performance data is displayed clearly, making it easier for team managers to assess and act on.
- Enhanced Decision-Making: By tracking KPIs and comparing current performance against targets and previous years, organizations can make better decisions about training, strategies, and player development.
Opportunity for Improvement in the E-sports KPI Dashboard
While the E-sports KPI Dashboard is a powerful tool, there are always opportunities to improve its capabilities:
- Integration with Live Data Sources: Integrating the dashboard with live game data sources can provide real-time tracking of in-game performance.
- Advanced Analytics Features: Adding more advanced features such as predictive analytics can help teams foresee future trends and adjust their strategies accordingly.
- Customization for Different Teams: While the dashboard is versatile, it could be tailored further to the unique needs of different E-sports teams based on their specific KPIs.
Best Practices for Using the E-sports KPI Dashboard
To get the most out of the E-sports KPI Dashboard, follow these best practices:
- Regularly Update Data: Ensure that actual performance data and targets are updated regularly to keep the dashboard accurate.
- Focus on Key Metrics: While many KPIs are tracked, focus on the most important ones for your team’s success to avoid information overload.
- Utilize the Drill-Through Functionality: The drill-through feature allows you to get detailed insights into each KPI. Make use of it to dive deeper into the metrics that matter most.
- Share Insights with the Team: Make sure that all team members and stakeholders have access to the dashboard and can view the performance data. This promotes transparency and alignment across the team.
Conclusion
The E-sports KPI Dashboard in Power BI is a game-changer for tracking, managing, and optimizing performance in the E-sports industry. By providing real-time insights, visualizing data, and allowing for data-driven decision-making, the dashboard ensures that teams and organizations are always one step ahead. Whether you’re tracking a player’s performance or analyzing team stats, Power BI offers a comprehensive solution to managing your E-sports operations.
Frequently Asked Questions (FAQs)
1. What is an E-sports KPI Dashboard?
An E-sports KPI Dashboard is a tool that tracks key performance indicators (KPIs) for teams and players in the E-sports industry. It visualizes important metrics like win rate, kills, deaths, and more.
2. How does Power BI help in managing E-sports performance?
Power BI helps by integrating data from various sources and providing interactive reports that track and visualize performance metrics, aiding in decision-making.
3. What KPIs should be tracked in an E-sports KPI Dashboard?
Key KPIs include win rate, kills/deaths ratio, damage per round, total playtime, and more. The dashboard allows customization to track the most relevant KPIs for your team.
4. Can the E-sports KPI Dashboard be customized for different teams?
Yes, the dashboard is customizable and can be tailored to suit the needs of individual teams based on their specific KPIs.
5. How often should data be updated in the dashboard?
Data should be updated regularly, ideally after every match or tournament, to ensure that performance metrics reflect the latest data.
Visit our YouTube channel to learn step-by-step video tutorials