The world of eCommerce is rapidly evolving, with online businesses constantly looking for ways to optimize their sales and conversion rates. To stay ahead in the game, businesses need to track key performance indicators (KPIs) that help them understand their website’s effectiveness in converting visitors into paying customers. One such critical metric is the Ecommerce Conversion Rate. This article will delve into the importance of the Ecommerce Conversion Rate KPI Dashboard in Excel, its key components, and how it can provide actionable insights to enhance your business performance.
What is the Ecommerce Conversion Rate?
Before diving into the specifics of the KPI dashboard, let’s first understand what Ecommerce Conversion Rate means. In simple terms, the conversion rate is the percentage of website visitors who take a desired action, such as completing a purchase, signing up for a newsletter, or filling out a contact form.
The formula for Ecommerce Conversion Rate is:
Conversion Rate=(Total ConversionsTotal Website Visitors)×100\text{Conversion Rate} = \left( \frac{\text{Total Conversions}}{\text{Total Website Visitors}} \right) \times 100
By tracking this metric, businesses can determine the effectiveness of their website design, product offerings, and marketing efforts in driving conversions.
Why is Ecommerce Conversion Rate Important?
The Ecommerce Conversion Rate is one of the most vital metrics for online stores. It helps you assess:
-
Website Effectiveness: A low conversion rate could indicate that visitors are not engaging with your site effectively.
-
Marketing ROI: Knowing your conversion rate helps you determine whether your marketing campaigns are driving actual sales.
-
Customer Experience: If the conversion rate is low, there might be issues with website navigation, checkout processes, or product descriptions.
-
Revenue Generation: Ultimately, the conversion rate directly correlates with sales and revenue, making it a key indicator of business health.
Key Features of the Ecommerce Conversion Rate KPI Dashboard
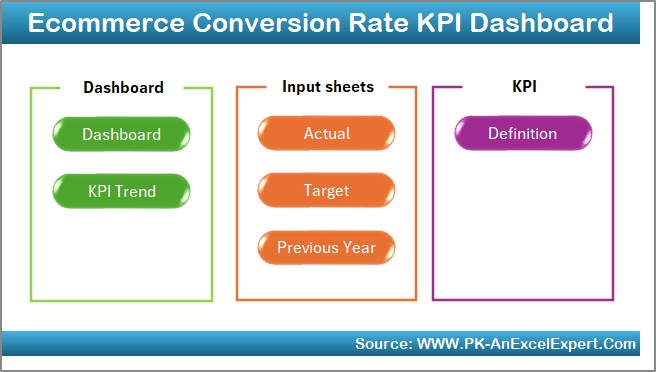
A well-designed Ecommerce Conversion Rate KPI Dashboard can offer a comprehensive overview of your business’s performance, helping you identify areas for improvement and make data-driven decisions. Below are the key features and worksheets included in the dashboard:
1. Home Sheet Tab
The Home Sheet Tab is your starting point. It contains an intuitive interface that allows you to easily navigate through the other tabs of the dashboard. With a simple click, you can jump to any section and view the necessary KPIs.
Click to buy Ecommerce Conversion Rate KPI Dashboard in Excel
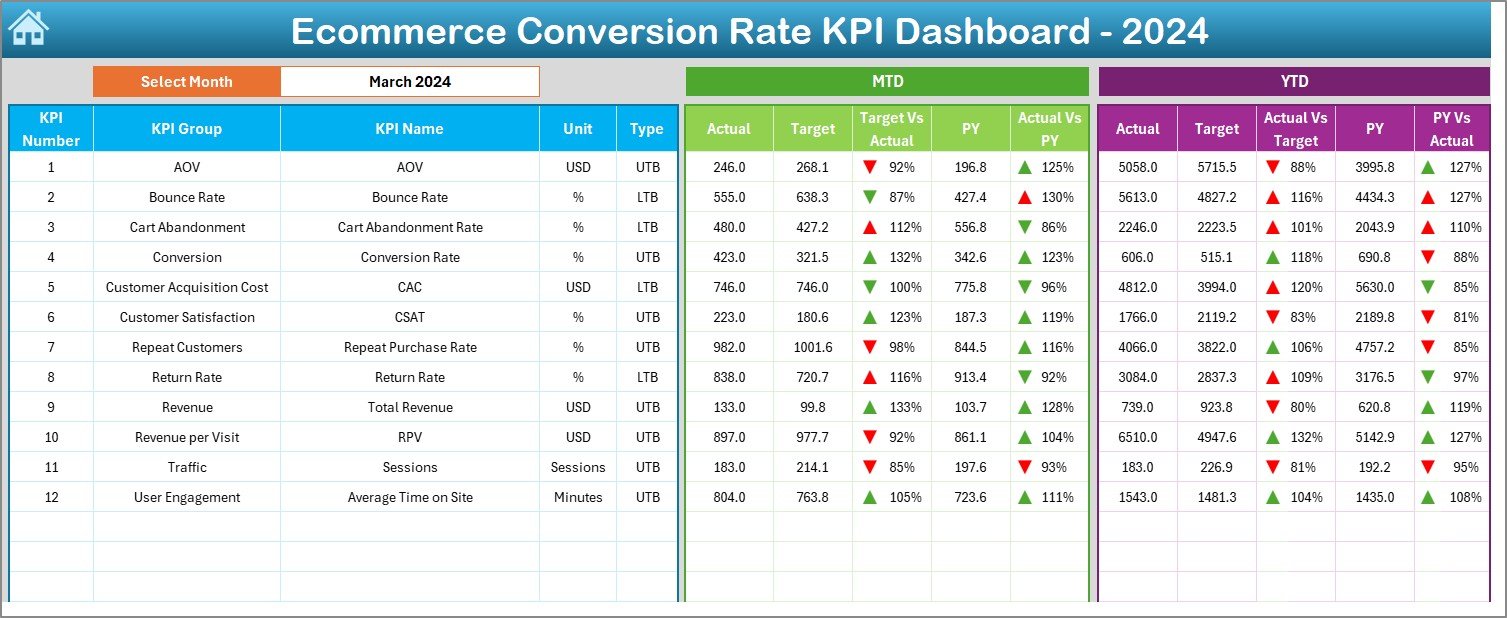
2. Dashboard Sheet Tab
This is the heart of your dashboard. The Dashboard Sheet Tab presents all your KPIs in a clear and concise format. It displays:
-
MTD (Month-to-Date) Actuals: View the actual performance for the selected month.
-
Target: Track your predefined targets.
-
Previous Year Data: Compare this year’s data with the previous year’s performance.
-
Conditional Formatting: Use up and down arrows to indicate whether the current month’s performance is above or below expectations.
You can select the desired month from the drop-down menu (Cell D3), and the entire dashboard will adjust accordingly. This makes it easy to track and compare monthly performance at a glance.
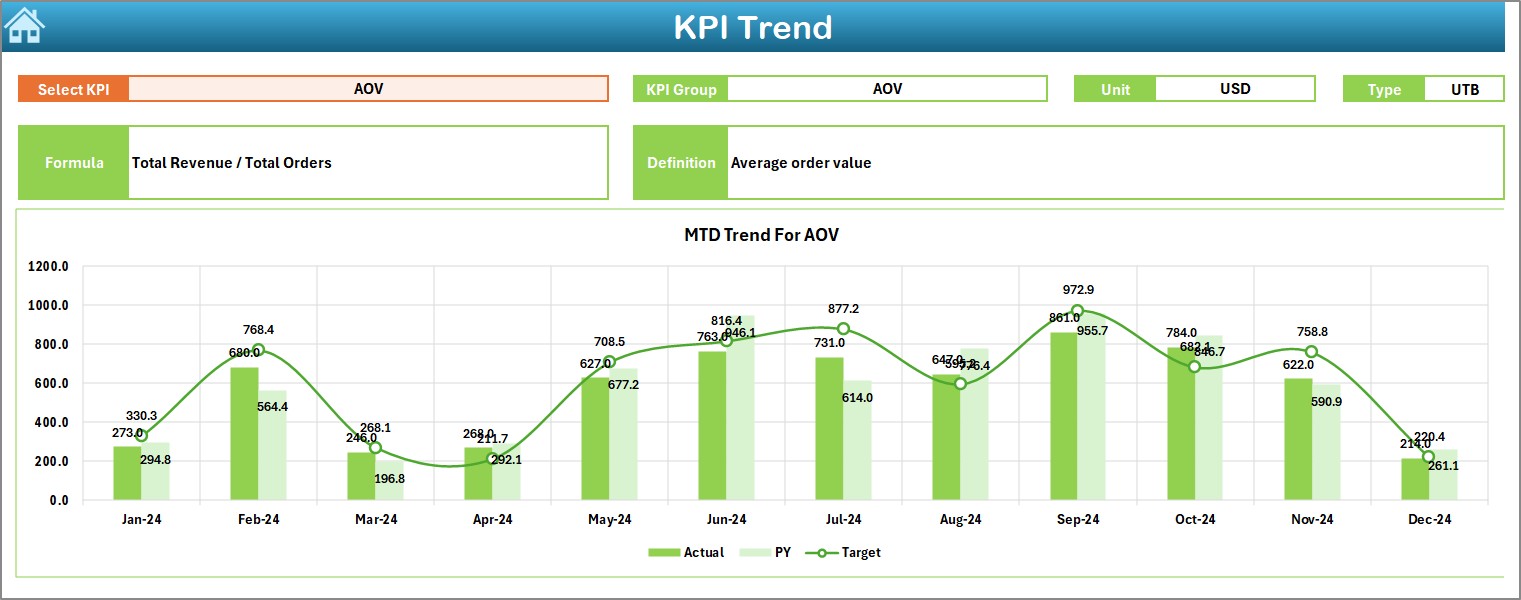
3. KPI Trend Sheet Tab
In the KPI Trend Sheet Tab, you can analyze the historical trends of different KPIs. By selecting a specific KPI from the drop-down list in cell C3, you can view:
-
KPI Group: Grouping of related KPIs (e.g., Sales, Traffic, Conversion)
-
Unit of Measurement: The unit in which the KPI is tracked (e.g., Percentage, Count, Dollars)
-
KPI Type: Indicates whether the KPI is “Lower the Better” (LTB) or “Upper the Better” (UTB).
-
Formula: The mathematical formula used to calculate the KPI.
-
Definition: A brief description of the KPI and its significance.
Click to buy Ecommerce Conversion Rate KPI Dashboard in Excel
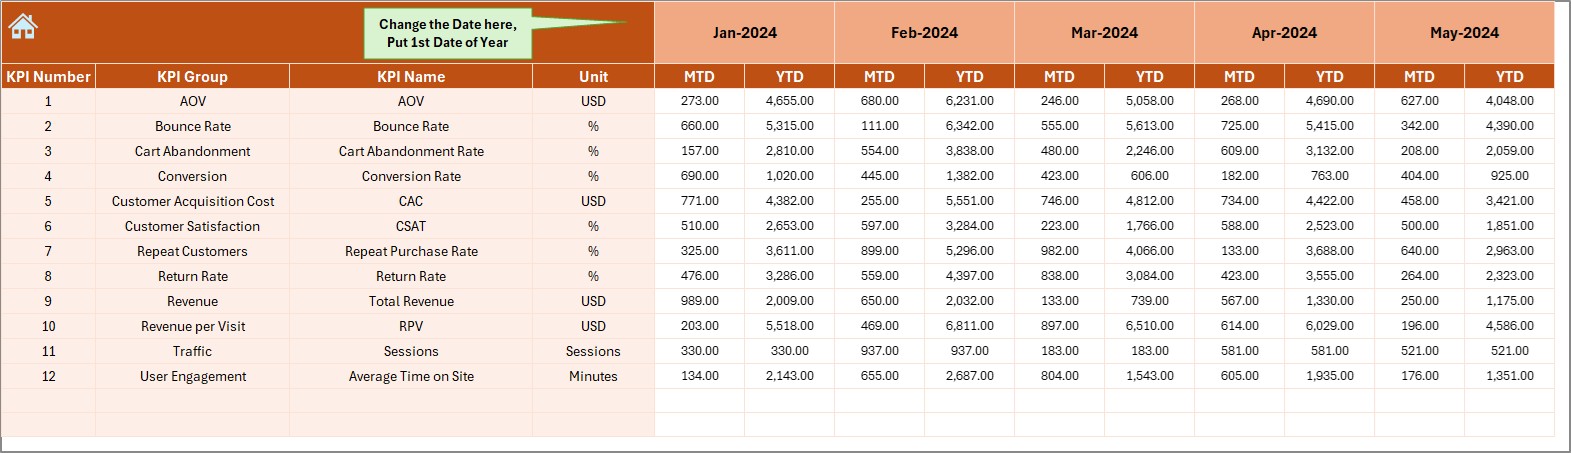
4. Actual Numbers Sheet Tab
This tab allows you to input the actual data for both MTD (Month-to-Date) and YTD (Year-to-Date) performance. You can change the month in cell E1, and the dashboard will reflect the new data for that month.
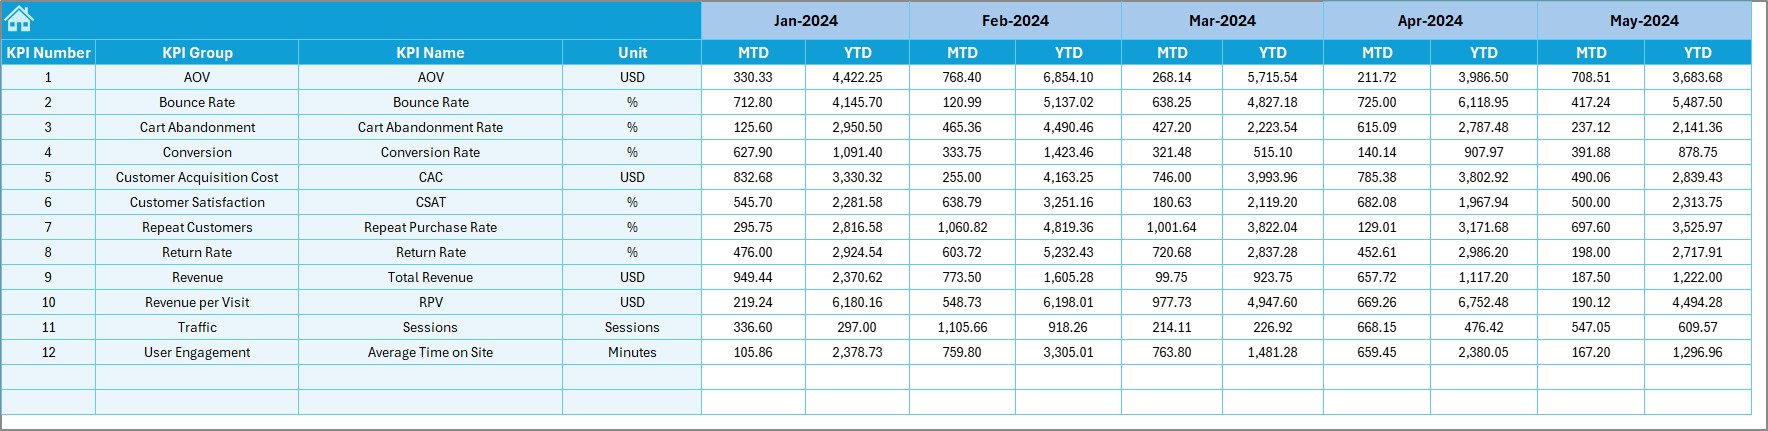
5. Target Sheet Tab
In the Target Sheet Tab, enter the target values for each KPI. These targets will help you compare your actual performance against the set goals, enabling you to track progress and identify any gaps.
Click to buy Ecommerce Conversion Rate KPI Dashboard in Excel
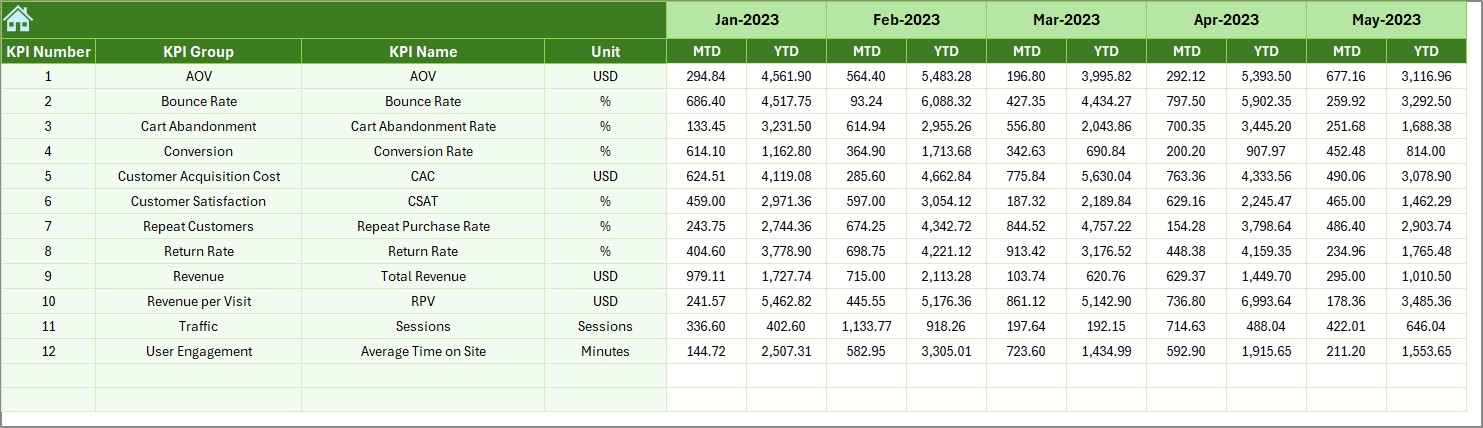
6. Previous Year Number Sheet Tab
This tab stores the previous year’s data, enabling you to compare current performance with historical data. Tracking the previous year’s numbers helps you assess growth and improvement over time.
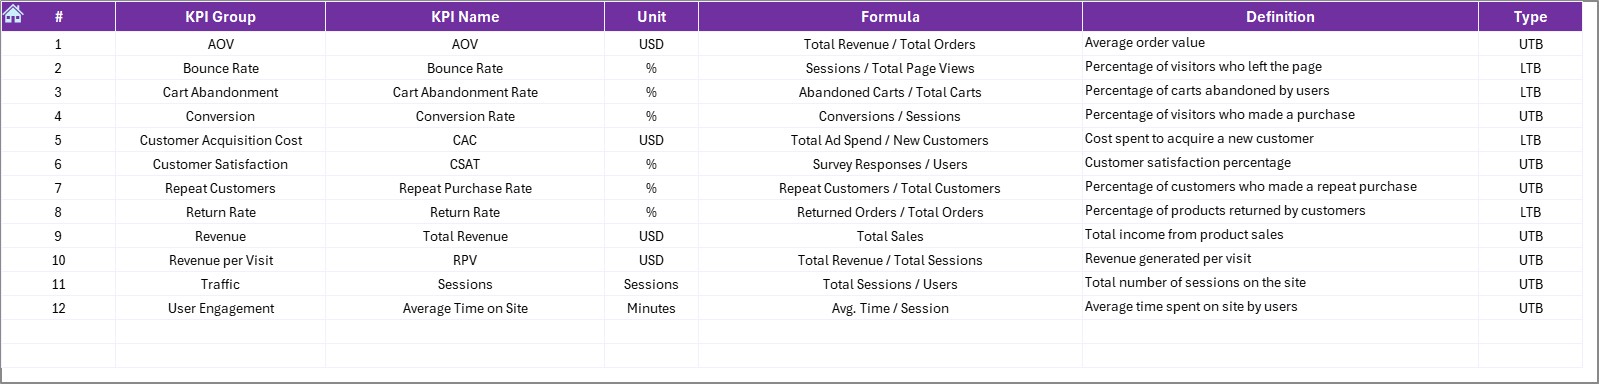
7. KPI Definition Sheet Tab
This sheet acts as the reference guide for all KPIs included in the dashboard. It contains a list of KPIs with their respective KPI Names, Groups, Units, Formulas, and Definitions.
Advantages of the Ecommerce Conversion Rate KPI Dashboard
Click to buy Ecommerce Conversion Rate KPI Dashboard in Excel
A well-structured Ecommerce Conversion Rate KPI Dashboard offers several advantages:
-
Clear Visualization: It provides a clear, at-a-glance view of your website’s performance, helping you track KPIs easily.
-
Data-Driven Decisions: By constantly monitoring conversion rates, businesses can make informed decisions regarding marketing, sales strategies, and website design.
-
Real-Time Monitoring: With the ability to update data instantly, you can monitor changes in conversion rates in real-time, allowing for swift corrective actions.
-
Benchmarking: Comparing your current conversion rates with previous data or industry standards helps set realistic targets and track progress.
-
Efficiency: Automating data entry and calculation with Excel formulas saves time and reduces the likelihood of errors.
Opportunities for Improvement in Ecommerce Conversion Rate
While the Ecommerce Conversion Rate KPI Dashboard provides valuable insights, there are always opportunities for improvement. Some key areas to focus on include:
-
Enhancing User Experience: A low conversion rate often indicates a poor user experience. Ensure your website is fast, mobile-friendly, and easy to navigate.
-
Optimizing the Checkout Process: Simplifying the checkout process and offering multiple payment options can help improve the conversion rate.
-
Personalization: Personalizing your website experience for users can increase the likelihood of conversions. Use data to recommend products based on browsing behavior.
-
A/B Testing: Regularly perform A/B tests on different parts of your website (e.g., call-to-action buttons, landing pages) to find out what works best for your audience.
Best Practices for Ecommerce Conversion Rate
To maximize the effectiveness of your Ecommerce Conversion Rate KPI Dashboard, follow these best practices:
-
Set Realistic Targets: Establish achievable targets based on historical data and industry benchmarks.
-
Focus on High-Impact KPIs: Prioritize KPIs that directly influence conversion rates, such as Average Order Value (AOV), Cart Abandonment Rate, and Customer Lifetime Value (CLV).
-
Regularly Update Data: Keep your dashboard updated with the latest data to ensure that you are working with accurate and relevant information.
-
Analyze and Act on Insights: Regularly analyze the data provided by the dashboard and take actionable steps to improve performance.
-
Leverage Automation: Use Excel formulas and automation tools to streamline the data entry process and ensure real-time updates.
Frequently Asked Questions (FAQs)
1. What is an Ecommerce Conversion Rate KPI?
An Ecommerce Conversion Rate KPI measures the percentage of website visitors who complete a desired action, such as making a purchase. It is an essential metric for evaluating the effectiveness of your eCommerce website in turning visitors into paying customers.
2. How do I calculate the Ecommerce Conversion Rate?
The formula for calculating the conversion rate is:
Conversion Rate=(Total ConversionsTotal Website Visitors)×100\text{Conversion Rate} = \left( \frac{\text{Total Conversions}}{\text{Total Website Visitors}} \right) \times 100
3. What are the key features of an Ecommerce Conversion Rate KPI Dashboard in Excel?
The dashboard includes features like MTD and YTD actuals, targets, previous year comparisons, and KPI trend analysis. It also provides an intuitive interface with drop-down options to select the month and track the performance of key metrics.
4. How can the Ecommerce Conversion Rate KPI Dashboard help my business?
The dashboard provides insights into website performance, helping businesses track KPIs, compare current performance with past data, and identify areas for improvement. It aids in making data-driven decisions to optimize conversions and revenue.
5. Can I customize the Ecommerce Conversion Rate KPI Dashboard?
Yes, the dashboard is fully customizable. You can adjust the targets, enter actual numbers, and tailor the KPI formulas to fit your business needs.
Conclusion
The Ecommerce Conversion Rate KPI Dashboard in Excel is an indispensable tool for eCommerce businesses aiming to optimize their website’s performance. By tracking and analyzing KPIs, businesses can make informed decisions, improve conversion rates, and ultimately boost revenue. The dashboard’s user-friendly design and powerful features offer a comprehensive solution for monitoring and improving key metrics. With regular updates and strategic improvements, you can enhance your website’s performance and achieve your business goals.
Visit our YouTube channel to learn step-by-step video tutorials
Click to buy Ecommerce Conversion Rate KPI Dashboard in Excel