In today’s data-driven world, managing and tracking key performance indicators (KPIs) for educational institutions has become a crucial part of decision-making and strategic planning. An Education KPI Dashboard in Excel can help schools, universities, and other educational organizations keep track of vital metrics to ensure performance improvement and accountability. This article will guide you through the features, best practices, advantages, and areas for improvement in using an Education KPI Dashboard in Excel.
Click to buy Education KPI Dashboard in Excel
Key Features of the Education KPI Dashboard
This Education KPI Dashboard is designed to be user-friendly, allowing educators and administrators to track progress with ease. The dashboard is divided into seven distinct worksheets, each serving a specific function:
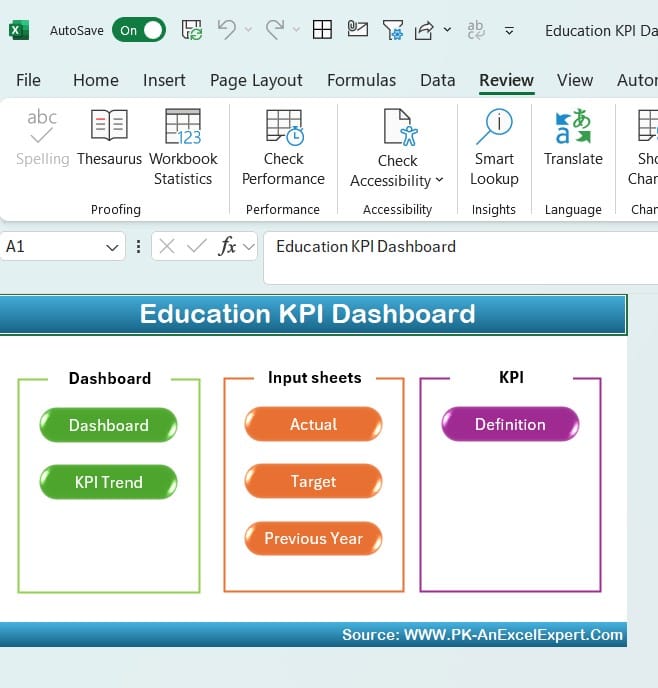
Home Sheet:
Click to buy Education KPI Dashboard in Excel
- Acts as an index for navigating the dashboard.
- Six buttons are provided to help users jump to the respective sheets quickly and efficiently.
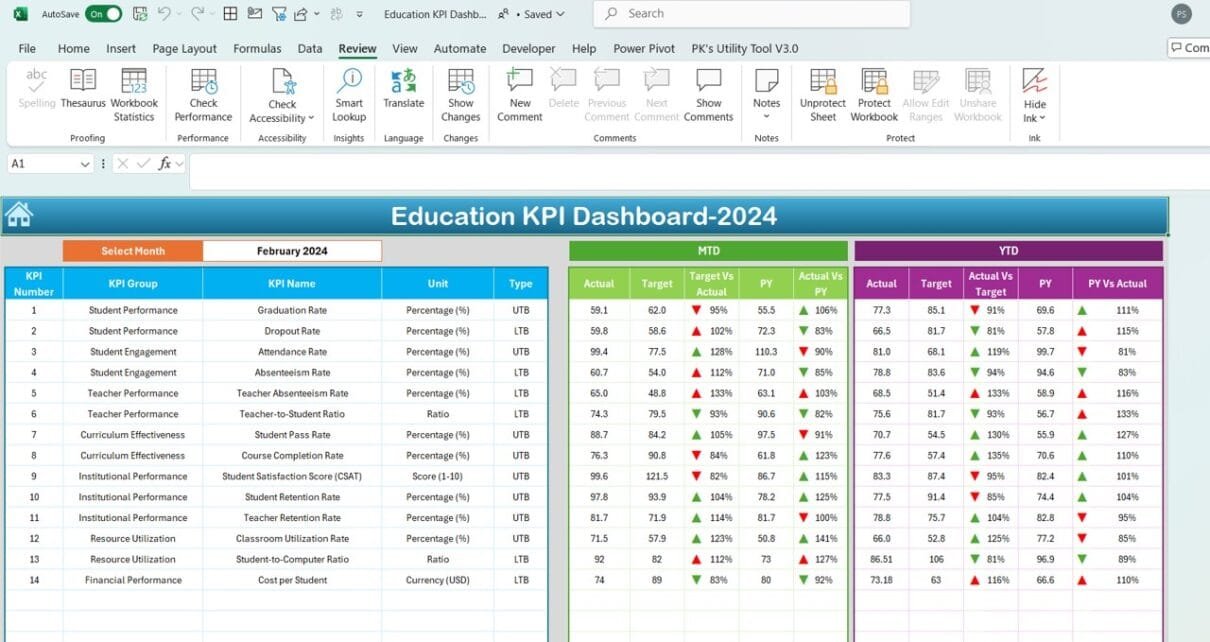
Dashboard Sheet:

Click to buy Education KPI Dashboard in Excel
- The core sheet where all KPI-related information is displayed.
- A drop-down in cell D3 allows users to select a specific month, instantly updating all metrics for the selected time period.
- Key metrics like MTD (Month-to-Date) Actual, Target, and Previous Year data are shown, allowing users to compare performance.
- The dashboard also includes Target vs Actual and PY vs Actual comparisons, utilizing conditional formatting with arrows to indicate trends.
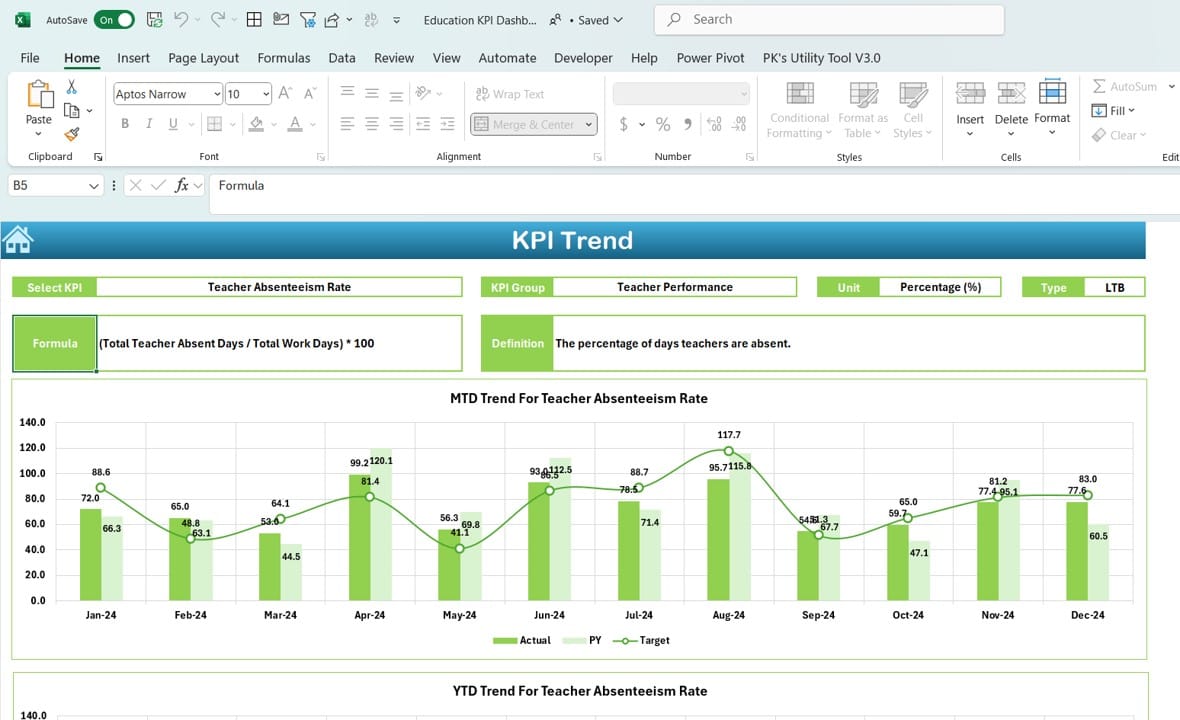
KPI Trend Sheet:
KPI Trend Sheet
Click to buy Education KPI Dashboard in Excel
- Here, users can choose a specific KPI from a drop-down menu located in cell C3.
- The sheet presents vital information such as KPI Group, Unit of KPI, and Type (whether Lower is Better or Upper is Better).
- Displays trends for MTD and YTD (Year-to-Date) with visually appealing charts.
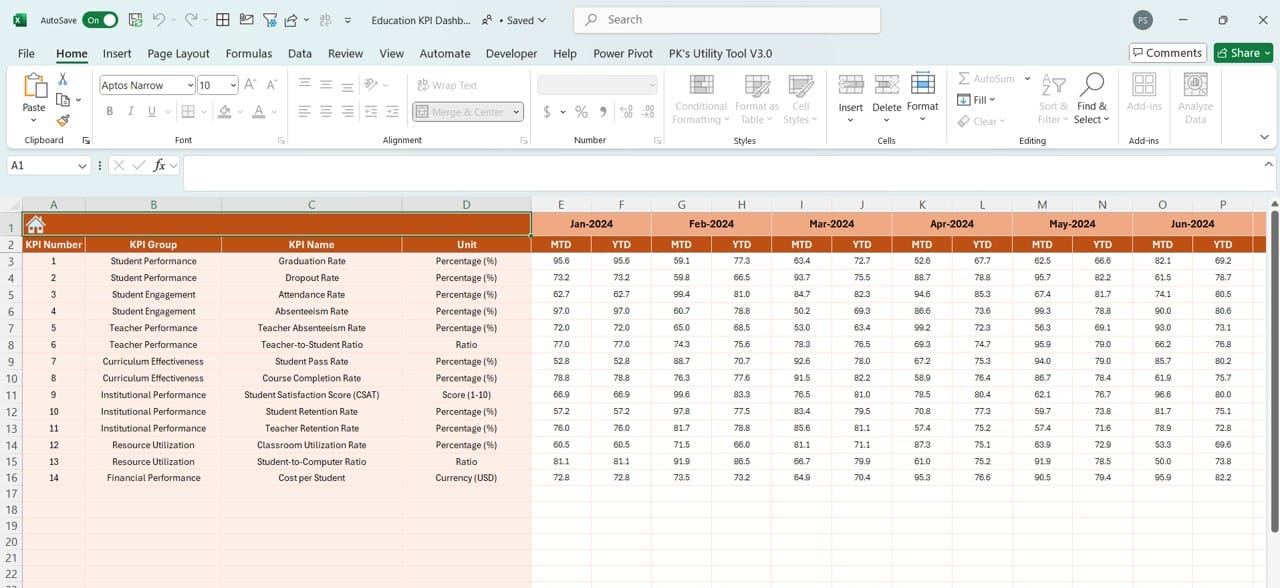
Actual Numbers Input Sheet:
Click to buy Education KPI Dashboard in Excel
- This sheet is designed to input actual numbers for each KPI.
- Users can select the month from range E1 to update MTD and YTD figures accordingly.
Target Sheet:
Click to buy Education KPI Dashboard in Excel
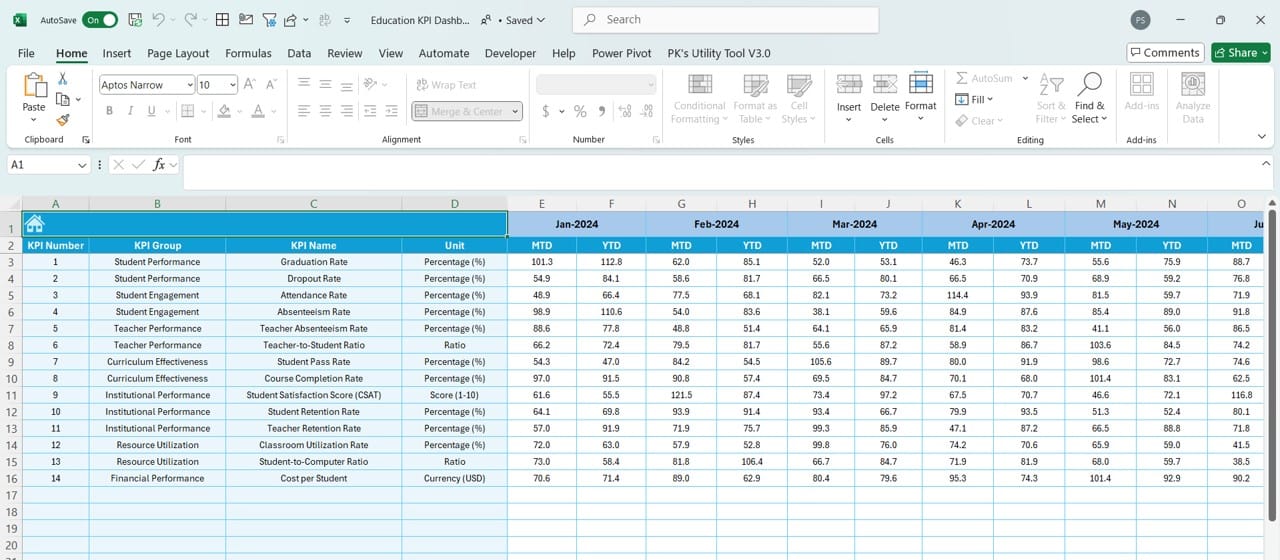
- Users enter the target values for both MTD and YTD for each KPI in this sheet.
- It’s essential to have clear, well-defined targets to benchmark against.
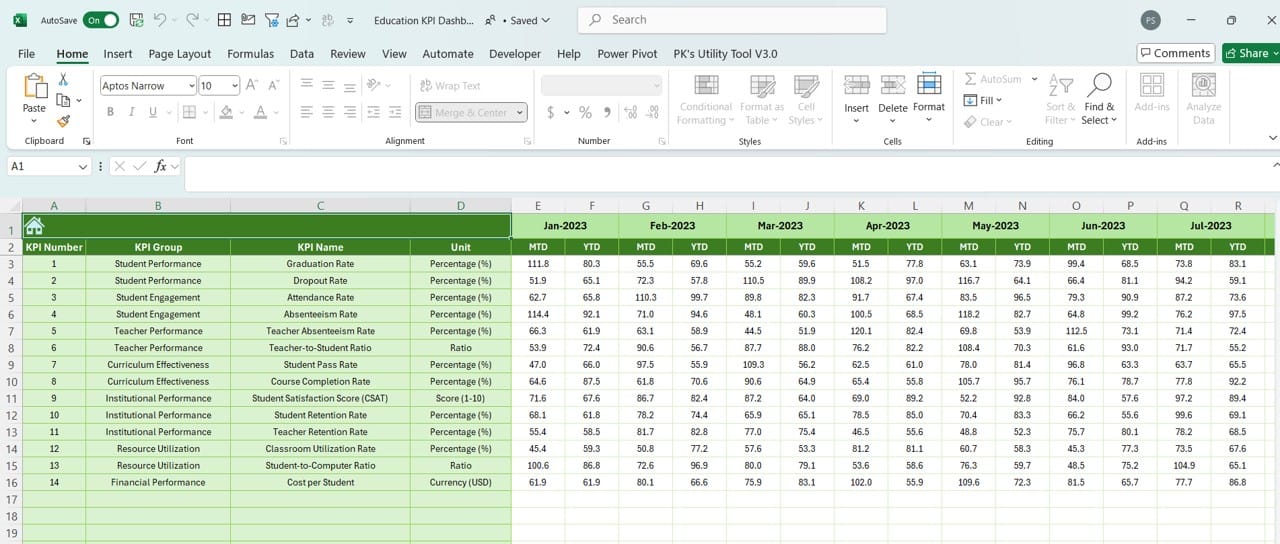
Previous Year Numbers Sheet:
Click to buy Education KPI Dashboard in Excel
- A similar format to the Actual Numbers sheet, this sheet is for inputting previous year’s data for comparison purposes.
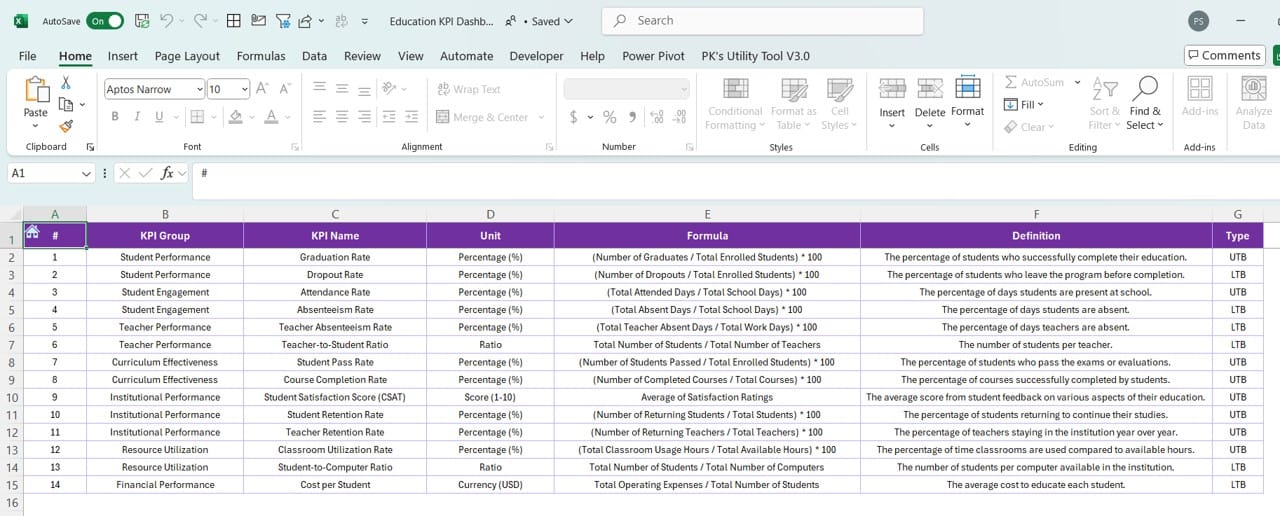
KPI Definition Sheet:
Click to buy Education KPI Dashboard in Excel
This is where users input the definition, formula, and other essential information for each KPI, ensuring clarity and consistency across the dashboard.
Advantages of the Education KPI Dashboard in Excel
There are several benefits to using an Education KPI Dashboard:
- Centralized Data Access: With all KPI information in one place, decision-makers can access and review performance metrics quickly.
- Dynamic Updates: The dashboard updates automatically based on selected months, ensuring that the most relevant data is always displayed.
- Target vs Actual Comparisons: The dashboard provides a clear picture of how the institution is performing compared to its targets, as well as how it compares to the previous year.
- Customizable KPI Definitions: Educational institutions can modify the dashboard based on their specific KPIs, making it a flexible tool.
- Conditional Formatting for Easy Insights: The use of conditional formatting with arrows offers a quick visual indication of performance trends, making it easy to spot improvements or areas that need attention.
Click to buy Education KPI Dashboard in Excel
Best Practices for Using the Education KPI Dashboard
To maximize the benefits of your Education KPI Dashboard, consider the following best practices:
- Regular Updates: Ensure that you consistently input actual data for each KPI. The dashboard’s effectiveness is reliant on accurate and up-to-date information.
- Set Realistic Targets: When entering target values, make sure they are achievable and aligned with the institution’s strategic goals. Over-ambitious targets may lead to discouragement, while too-easy targets won’t drive improvement.
- Leverage Trends for Decision-Making: Use the trends in MTD and YTD data to make informed decisions. Consistent underperformance in certain KPIs can indicate deeper issues that need to be addressed.
- Customization Based on Institution Needs: Educational institutions vary in their focus. Be sure to customize the KPIs tracked in the dashboard to match the specific goals of your organization.
- Involve Stakeholders: Share the dashboard with key stakeholders regularly. Engaging teachers, department heads, and administrators with KPI data can foster a culture of continuous improvement.
Click to buy Education KPI Dashboard in Excel
Opportunities for Improvement in the Education KPI Dashboard
While the Education KPI Dashboard is a powerful tool, there are areas where it can be further improved:
- Automation of Data Entry: One area of improvement is automating the data entry process. Currently, users must manually input actual and target numbers. Automating this process by linking the dashboard to a central database or an online system could save time and reduce errors.
- Integration with Other Tools: Integration with other platforms like Power BI, Google Sheets, or even Learning Management Systems (LMS) can enhance the functionality of the dashboard by pulling real-time data.
- Visualization Enhancements: While the current dashboard uses charts to present trends, advanced visualization techniques (like interactive graphs or dashboards) can make it more engaging and easier to interpret.
- Advanced Conditional Formatting: Conditional formatting is an excellent feature, but its effectiveness could be enhanced by adding more nuanced indicators like cooler gradients for values in a range, or even including alerts for significant deviations from targets.
Click to buy Education KPI Dashboard in Excel
How to Customize Your Education KPI Dashboard
Creating a tailored Education KPI Dashboard can give you more control over the performance metrics that matter most to your institution. Here’s how you can personalize your dashboard:
- Choose KPIs That Reflect Your Institution’s Goals: Not every institution will track the same KPIs. For example, some schools may prioritize student attendance rates, while others focus more on faculty productivity. Select KPIs that directly align with your institution’s mission and vision.
- Adjust Targets Based on Historical Performance: Use data from previous years to set realistic, data-driven targets. This approach provides a more accurate baseline for measuring growth or areas of concern.
- Add Additional KPI Sheets: If your institution has more than the KPIs listed, consider adding new sheets to the dashboard for easy tracking.
Conclusion
The Education KPI Dashboard in Excel is a comprehensive tool for tracking the performance of educational institutions. Its ability to display trends, compare data across time periods, and present dynamic KPI information makes it an invaluable asset for decision-makers. By following best practices and identifying areas for improvement, you can ensure that your dashboard remains a powerful tool for driving success in education.
Click to buy Education KPI Dashboard in Excel
Frequently Asked Questions (FAQs)
Q. What are KPIs in education?
KPIs, or Key Performance Indicators, in education measure an institution’s performance in various areas, such as student achievement, attendance, faculty productivity, and more. These metrics help administrators assess whether the institution is meeting its goals.
Q. How can I update the data in my Education KPI Dashboard?
To update the data, simply navigate to the “Actual Numbers Input” and “Previous Year Numbers” sheets. Input the relevant data for each month and year as necessary. The dashboard will automatically update based on these inputs.
Q. What KPIs should I track in my education dashboard?
The KPIs to track depend on your institution’s focus. Common KPIs include graduation rates, attendance, faculty-student ratio, and student engagement levels.
Q. Can the dashboard be integrated with other tools?
Yes, with some advanced customization, you can integrate the dashboard with tools like Power BI or Google Sheets, which can help automate data collection and provide more advanced visualizations.
Q. How often should I update the Education KPI Dashboard?
It’s best to update the dashboard at the end of every month or term, depending on how frequently your institution measures performance.
By leveraging the full potential of your Education KPI Dashboard, you’ll be equipped to drive improvement, ensure accountability, and guide your institution toward sustained success.
Click to buy Education KPI Dashboard in Excel
Visit our YouTube channel to learn step-by-step video tutorials
Click to buy Education KPI Dashboard in Excel