In this article, we have created an Employee and Supervisor Chart with Arrow info graphics in Microsoft Excel. it’s a dynamic way to display hierarchical relationships within organizations, showcasing the bonds between supervisors and their teams in a manner that’s both engaging and informative.
Employee and Supervisor Chart with Arrow info graphics
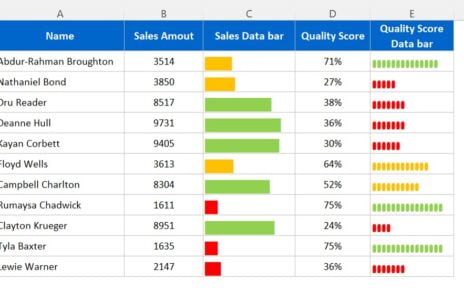
Data Set:
We have the Supervisor Name in Column A, Employee Name in Column B and Sales Amount in the Column C.
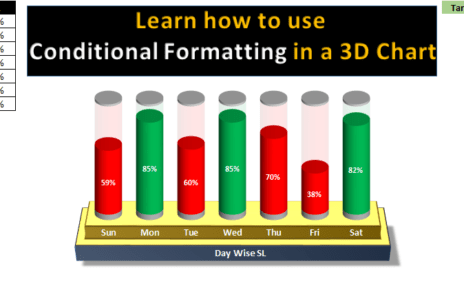
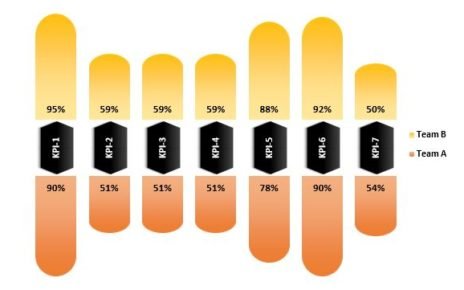
Chart:
Below is the snapshot of the chart-
Click to buy Employee and Supervisor Chart with Arrow info graphics
Visit our YouTube channel to learn step-by-step video tutorials
Watch the step-by-step video tutorial:
Click to buy Employee and Supervisor Chart with Arrow info graphics