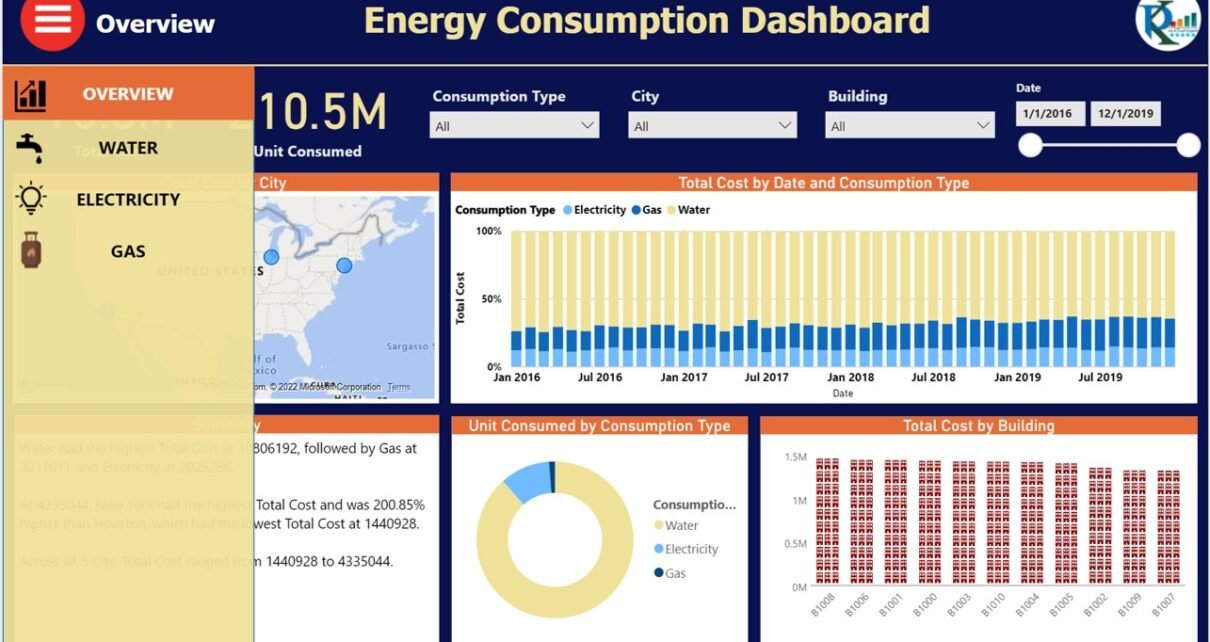
We have created this Energy Consumptions Dashboard in Microsoft Power BI. We have explained step by step data transformation in Power Query, Creation of the Relationship between fact & dimension tables, DAX measures and Visualization with Navigation Bar with bookmarks and Page Navigator button.
Click to buy Energy Consumptions Dashboard in Power BI
Click to buy Energy Consumptions Dashboard in Power BI
See the live dashboard:
See our other Power BI dashboards:
Click to buy Energy Consumptions Dashboard in Power BI
- Quality Analysis Dashboard in Power BI
- Comparative Analysis Dashboard in Power BI
- Time Series Forecast and Anomaly Detection in Power BI
Visit our YouTube channel to learn step-by-step video tutorials
Watch the step-by-step video tutorial:
Click to buy Energy Consumptions Dashboard in Power BI