In today’s corporate landscape, businesses focus on more than just financial success. Companies must also demonstrate their commitment to sustainability, ethical practices, and governance. This is where ESG KPI Dashboard in Excel come into play. These dashboards help organizations track, measure, and improve their ESG performance with real-time insights and visual analytics.
In this article, we’ll explore the importance of ESG KPIs, the structure of an Excel-based ESG KPI Dashboard, its key features, benefits, best practices, and common FAQs to ensure you get the most out of this powerful tool.
What is an ESG KPI Dashboard?
An ESG KPI Dashboard is an interactive Excel-based reporting system that helps organizations monitor Environmental, Social, and Governance (ESG) metrics in one place. It consolidates data from various sources and presents key insights in an easy-to-read format.
Why is it Important?
- Improves transparency: Stakeholders can access up-to-date ESG performance metrics.
- Facilitates compliance: Helps organizations adhere to sustainability reporting standards.
- Enhances decision-making: Provides actionable insights to improve ESG performance.
- Boosts corporate reputation: Showcases a company’s commitment to sustainability and ethical governance.
Key Features of the ESG KPI Dashboard in Excel
- This ready-to-use template includes seven well-structured worksheets, each serving a specific purpose.
Home Sheet (Navigation Panel)
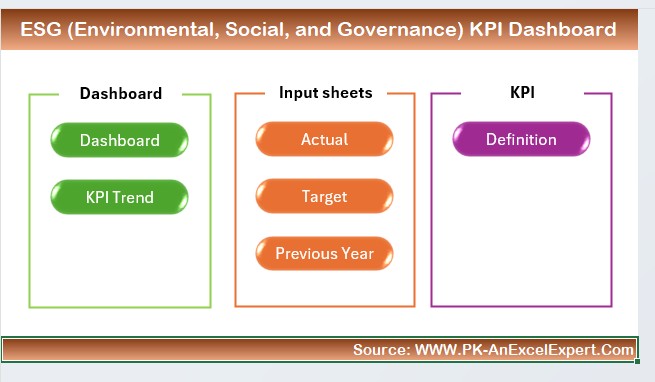
- Acts as an index page with six buttons for quick navigation to different sheets.
- Provides an organized structure for seamless access to key dashboard elements.
Dashboard Sheet Tab (Main Overview)
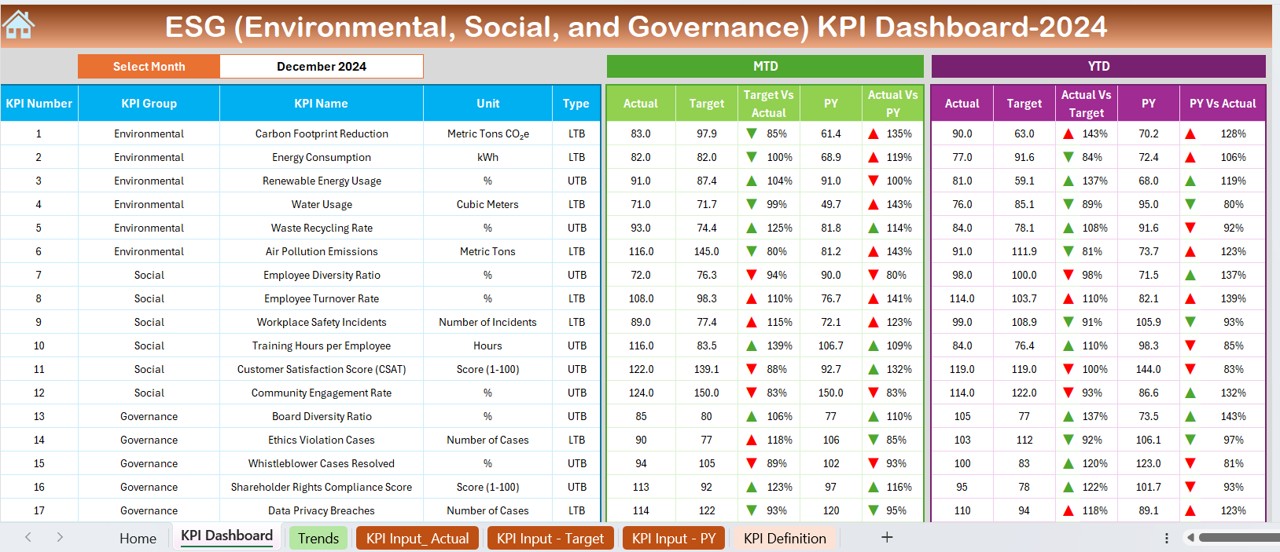
- The core section where all ESG KPIs are displayed.
- Users can select the month using a drop-down in cell D3, dynamically updating the dashboard.
- Presents data in MTD (Month-to-Date) and YTD (Year-to-Date) formats.
- Displays Target vs. Actual and Previous Year vs. Actual comparisons using conditional formatting (up/down arrows for quick visual interpretation).
KPI Trend Sheet Tab
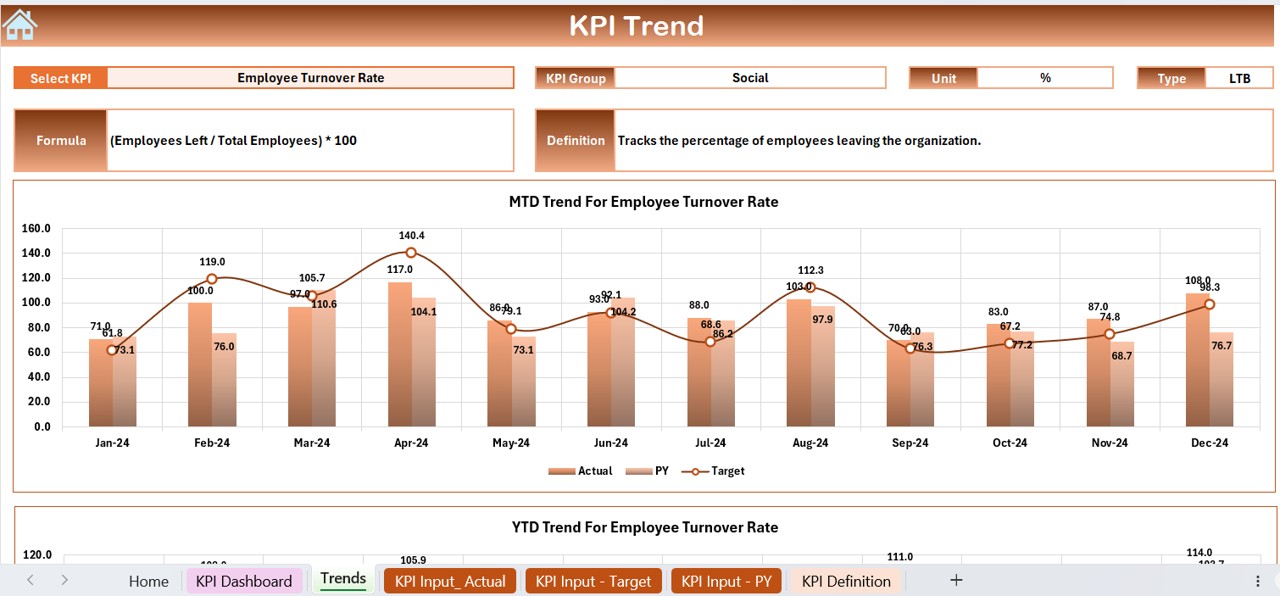
Allows selection of a specific KPI via a drop-down in cell C3.
- Displays:
- KPI Group
- Measurement Unit
- Type (Lower is Better / Higher is Better)
- Formula and Definition
- Showcases trend charts for MTD and YTD Actual, Target, and Previous Year data.
Actual Numbers Input Sheet

- Users manually input actual ESG performance data.
- The month can be adjusted in cell E1.
Target Sheet Tab

- Users set target values for each KPI for both MTD and YTD.
Previous Year Numbers Sheet Tab

- Stores historical data for comparison with current values.
KPI Definition Sheet Tab

- Users input KPI Names, Groups, Units, Formulas, and Definitions.
- Ensures clarity and standardization in ESG KPI measurement.
Advantages of Using an ESG KPI Dashboard in Excel
Real-Time ESG Tracking
- Track MTD and YTD performance of all key ESG metrics.
- Identify areas needing improvement instantly.
Data-Driven Decision Making
- Helps stakeholders make informed decisions based on clear KPI trends and visualizations.
Saves Time and Effort
- Automates data consolidation and eliminates the need for manual calculations.
Customizable and Scalable
- Add new ESG metrics and modify formulas as per evolving business needs.
Regulatory Compliance and Reporting
- Ensures companies stay compliant with global ESG regulations.
Best Practices for ESG KPI Dashboards
Define Clear ESG Goals
- Identify key ESG priorities relevant to your industry.
- Align KPIs with corporate sustainability objectives.
Ensure Data Accuracy
- Regularly update Actual, Target, and Previous Year data.
- Use data validation techniques to minimize errors.
Leverage Visual Elements
- Utilize conditional formatting, charts, and graphs for better insights.
- Highlight performance trends with color-coded indicators.
Regularly Review and Improve KPIs
- Conduct periodic reviews to keep ESG metrics aligned with business needs.
- Adjust formulas and targets to match evolving sustainability standards.
Conclusion
An ESG KPI Dashboard in Excel is a game-changer for businesses aiming to improve sustainability, transparency, and corporate governance. With features like MTD/YTD performance tracking, trend analysis, and automated calculations, organizations can streamline ESG monitoring and reporting efficiently. By implementing best practices, businesses can enhance their ESG strategy and make data-driven decisions for a more sustainable future.
Frequently Asked Questions (FAQs)
What are ESG KPIs, and why are they important?
ESG KPIs are performance metrics that measure a company’s environmental, social, and governance impact. They are crucial for transparency, regulatory compliance, and stakeholder trust.
Can I customize this ESG KPI Dashboard in Excel?
Yes! The Excel template is fully customizable—you can add new KPIs, modify formulas, and adjust targets based on your company’s ESG strategy.
How often should I update my ESG KPI Dashboard?
It is recommended to update the dashboard monthly to reflect the latest data trends and performance insights.
What industries can benefit from this ESG Dashboard?
Any business that prioritizes sustainability and governance can benefit, including manufacturing, finance, healthcare, retail, and IT.
Visit our YouTube channel to learn step-by-step video tutorials