Let’s face it: managing events today is more than just organizing schedules and sending out invites. Whether you’re putting together a corporate conference, a festival, or even a wedding, knowing how to measure your success is crucial. You want to know what worked and what didn’t. This is where an Event Management KPI Dashboard becomes your best friend.
In this article, we’ll take a deep dive into what an Event Management KPI Dashboard is, the KPIs it tracks, why it’s useful, and the best ways to make the most of it. By the time you finish reading, you’ll be confident in how this tool can help you run more successful events in the future.
What Exactly is an Event Management KPI Dashboard?
In simple terms, an Event Management KPI Dashboard is a tool that lets you monitor and evaluate the key performance indicators (KPIs) of your event. Whether it’s ticket sales, attendee satisfaction, or social media engagement, the dashboard puts all the important data at your fingertips. This makes it easier to make smart, quick decisions as your event unfolds.
What’s great about this dashboard is that it’s highly customizable. Whether you’re handling a small wedding or a massive corporate summit, the dashboard adapts to your event’s specific needs.
Key Features of the Event Management KPI Dashboard
This dashboard is designed to simplify tracking, and it’s super easy to use. Let’s walk through its core features:
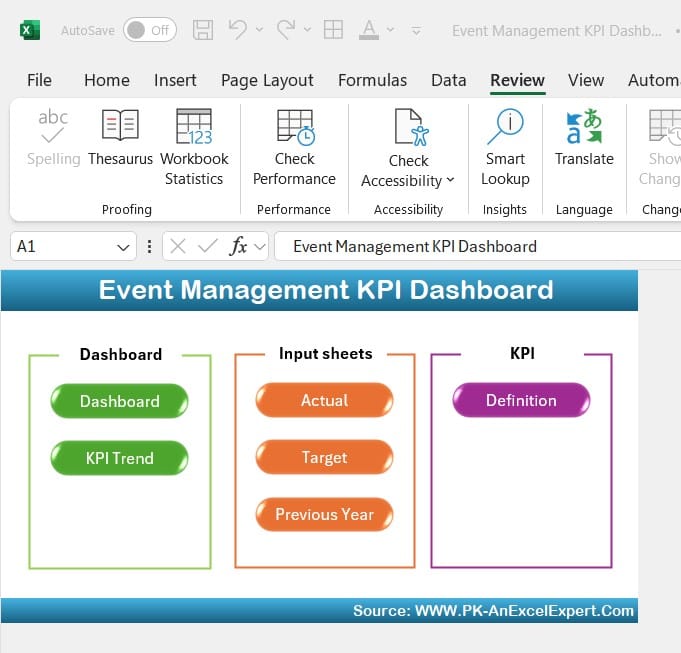
- Home Sheet
This is the “control center” of the dashboard. From the Home Sheet, you can easily navigate to all other sections. There are six buttons that take you to various parts of the dashboard, making sure you have a smooth and hassle-free experience.
Click to buy Event Management KPI Dashboard
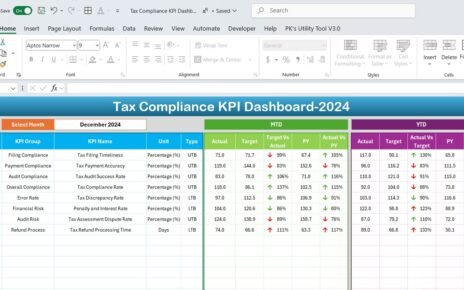
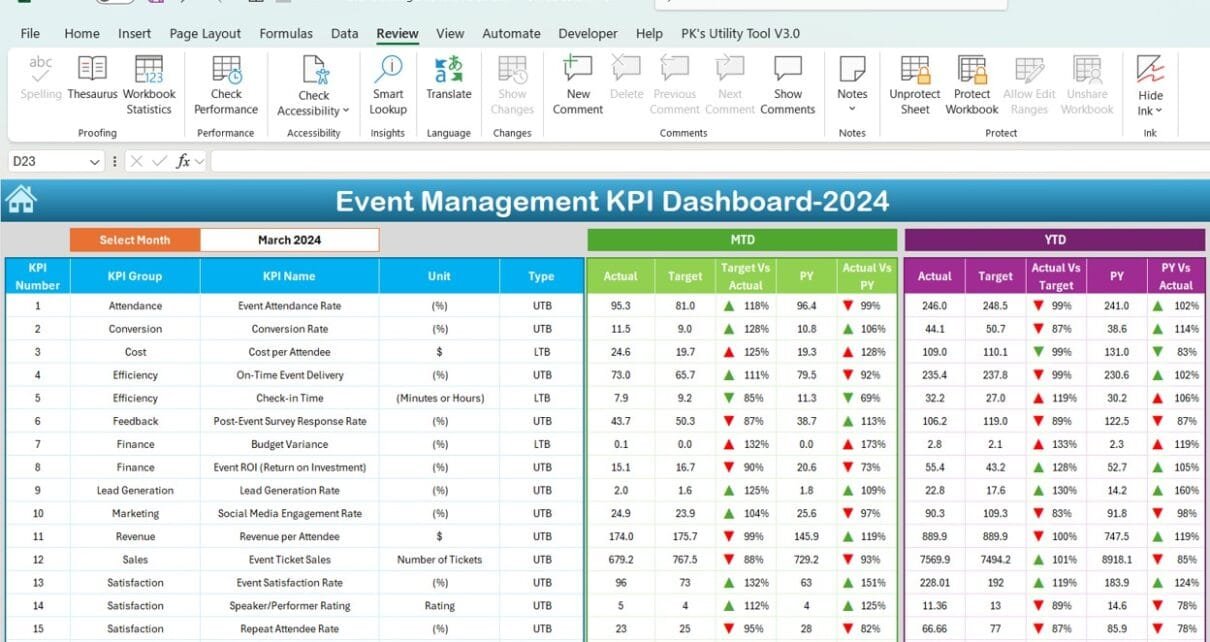
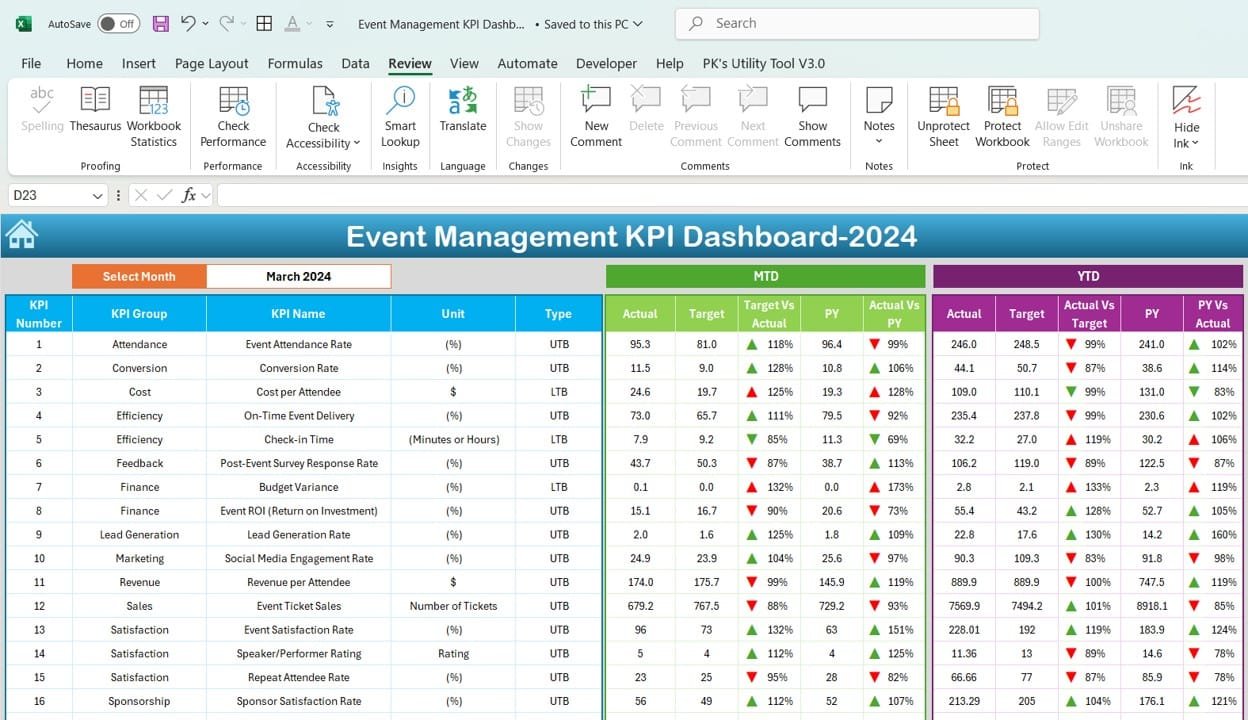
- Dashboard Sheet
Here’s where the magic happens! The Dashboard Sheet is where you’ll see all the most important information:
MTD (Month-to-Date) Data: You can view actual values for each KPI, compare them to targets, and see last year’s data all in one place.
YTD (Year-to-Date) Data: You can track performance over the course of the year, which gives you a more long-term view.
Conditional Formatting: You’ll find up/down arrows that make it easy to compare Target vs. Actual and Previous Year (PY) vs. Actual performance.
Dropdown to Select Month: Need to switch months? No problem! There’s a simple dropdown that lets you view the data for any month you need.
Click to buy Event Management KPI Dashboard
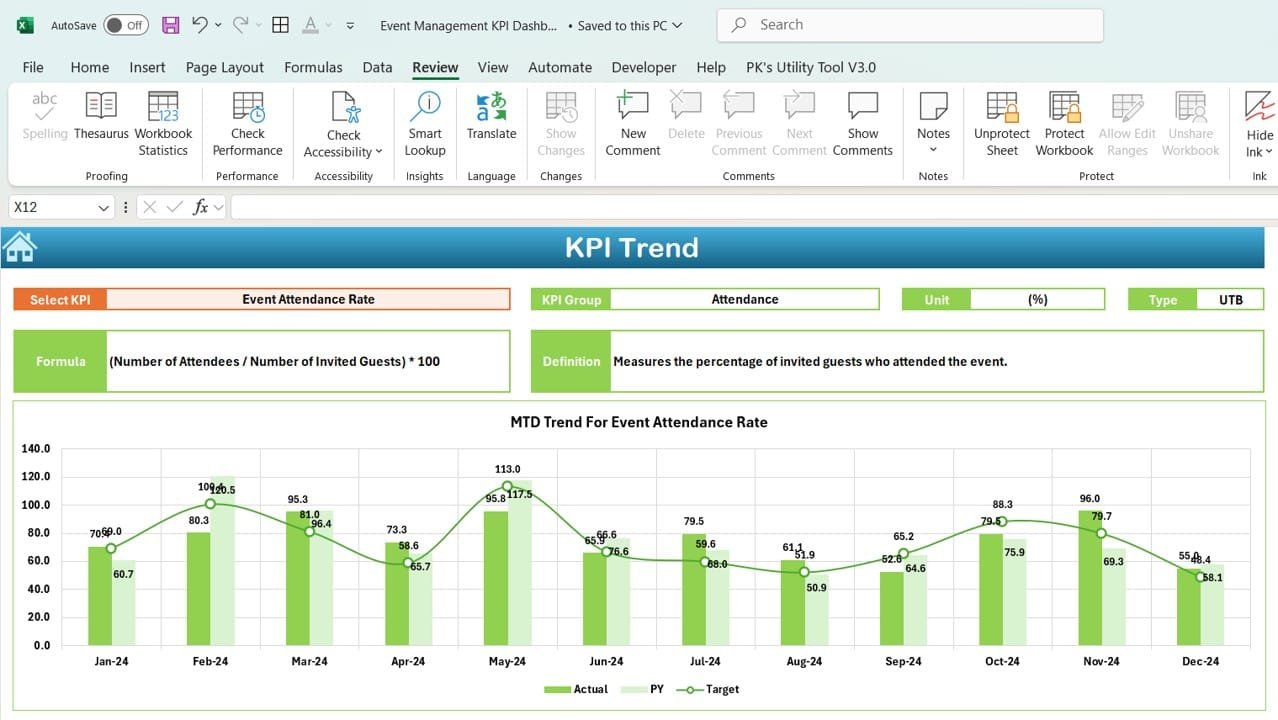
- KPI Trend Sheet
Want to track how each KPI has performed over time? The KPI Trend Sheet is your go-to.
KPI Group, Unit, and Type: Select any KPI from a dropdown list and see its group, the unit of measurement, and whether a higher or lower value is better.
Formula and Definition: It’s important to understand how each KPI is calculated, and this sheet gives you that insight. You can easily view the formula and definition to know exactly what you’re tracking.
Click to buy Event Management KPI Dashboard
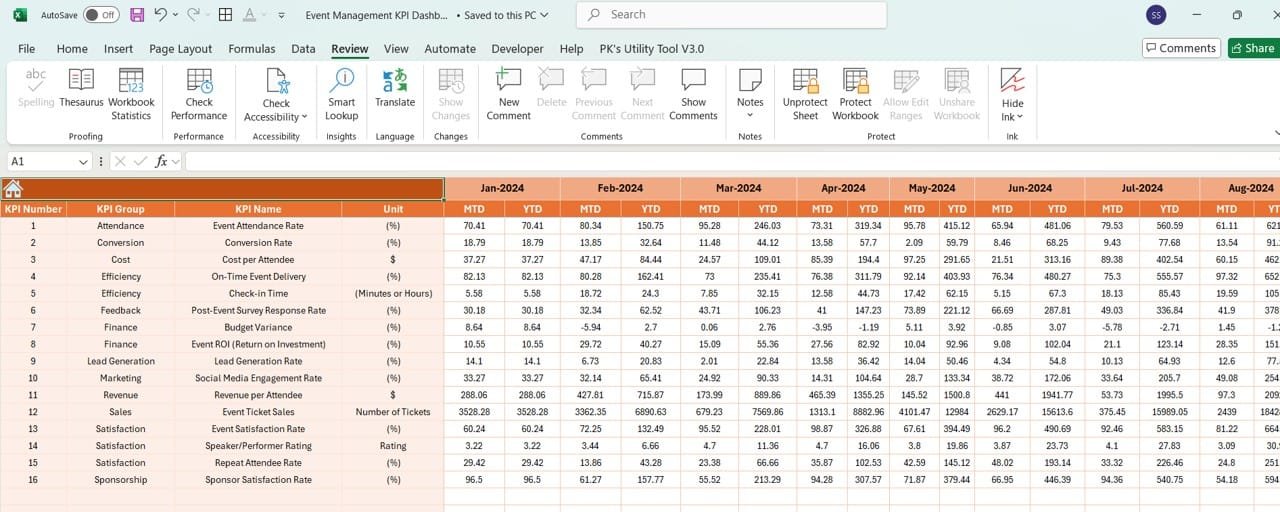
- Actual Numbers Sheet
This sheet is where you enter your real data. The Actual Numbers Sheet updates the dashboard in real time whenever you enter MTD and YTD numbers for any KPI. Just update the month in cell E1, and your dashboard will reflect the latest figures.
Click to buy Event Management KPI Dashboard
- Target Sheet
Setting goals is essential for measuring success. In the Target Sheet, you input your target numbers for each KPI, both for MTD and YTD. This makes sure that you have clear goals for each aspect of your event.

Click to buy Event Management KPI Dashboard
- Previous Year Numbers Sheet
What better way to see if you’re improving than by comparing this year’s data to last year’s? The Previous Year Numbers Sheet lets you input last year’s figures so you can quickly see if your event is growing or if there’s room for improvement.

Click to buy Event Management KPI Dashboard
- KPI Definition Sheet
This sheet is your cheat sheet for understanding each KPI. It includes:
- KPI Name
- KPI Group
- Unit of Measurement
- Formula for Calculation
- KPI Definition
By keeping everyone on the same page, this sheet ensures consistency across your team.

Click to buy Event Management KPI Dashboard
Advantages of Using an Event Management KPI Dashboard
Now that you know what’s inside the dashboard, let’s talk about the benefits of using it. Here’s why event managers love this tool:
- Better Decision-Making
Because all your key metrics are in one place, you can quickly see how your event is performing and make decisions on the fly. For example, if ticket sales are lower than expected, you can immediately adjust your marketing efforts to boost them.
- Real-Time Tracking
The dashboard updates as you input data. This is especially useful for larger events that span multiple days. You’ll have up-to-the-minute insights into your event’s success.
- Year-Over-Year Performance Analysis
The dashboard gives you the ability to compare this year’s performance with last year’s numbers. This is a great way to spot trends, understand growth, or find areas that need improvement.
- Increased Accountability
By assigning specific KPIs to team members, you make it clear who is responsible for each metric. The dashboard makes it easy to track progress, which increases accountability and ensures everyone is working toward the same goals.
- Focus on What’s Important
Rather than drowning in data, the dashboard focuses on the KPIs that matter most to your event’s success. Whether it’s sponsor satisfaction or ticket sales, the dashboard highlights what’s crucial.
Best Practices for Using the Event Management KPI Dashboard
While the dashboard is powerful, getting the most out of it requires some smart practices. Here’s how you can maximize its value:
- Set Realistic Goals
Your targets should push your team to perform but not be so far out of reach that they become discouraging. Make sure your goals are both challenging and achievable.
- Keep Your Data Updated
Your decisions are only as good as your data. Make sure to regularly update the dashboard with the most current numbers to ensure your insights are accurate.
- Leverage Past Performance
Use the Previous Year Numbers Sheet to set benchmarks. This historical data is key for understanding where you are improving and where you need to do better.
- Take Advantage of Conditional Formatting
Visual indicators like arrows and color-coded cells make it easy to spot trends and issues at a glance. Ensure your team understands how to read these cues so that they can act quickly.
- Customize for Your Event
Not every event is the same, so make sure your dashboard reflects the unique needs of your event. For example, ticket sales might be critical for a music festival, but lead generation or sponsor satisfaction could be the most important KPIs for a business conference.
Opportunities for Improvement in the Event Management KPI Dashboard
Even though the Event Management KPI Dashboard is incredibly useful, there are always ways to make it even better. Here are some potential improvements:
- Automating Data Input
Right now, you need to manually input data into the dashboard. By automating this process—perhaps by linking it with your event management software—you can save time and reduce the chances of errors.
- Make It Mobile-Friendly
Event planners are often on the go, so a mobile-friendly version of the dashboard would be a game-changer. It would allow you to check your KPIs from anywhere, whether you’re at the venue or off-site.
- Add Predictive Analytics
Imagine if your dashboard could help you predict how your event might perform based on past data. Adding predictive analytics would give you the power to foresee potential challenges and fix them before they happen.
- Integrating Attendee Feedback
Integrating feedback mechanisms directly into the dashboard allows you to gather real-time insights from your attendees. This helps you adjust things on the fly, ensuring that your event runs smoothly and meets attendees’ expectations.
Frequently Asked Questions (FAQs)
Q. What is an Event Management KPI Dashboard?
An Event Management KPI Dashboard is a tool that tracks key performance indicators (KPIs) for your event, allowing you to monitor the event’s success and make informed decisions based on data.
Q. How do I choose the right KPIs for my event?
The right KPIs depend on your event’s goals. For example, a concert may prioritize ticket sales and attendance rates, while a corporate event might focus on sponsor satisfaction and lead generation.
Q. Can I customize the Event Management KPI Dashboard?
Yes! The dashboard is fully customizable. You can add or remove KPIs based on what’s important for your event and adjust it as your event evolves.
Visit our YouTube channel to learn step-by-step video tutorials
Click to buy Event Management KPI Dashboard