In the fast-evolving world of manufacturing, factory automation is a critical factor in achieving operational efficiency, reducing costs, and enhancing product quality. Factory automation integrates various control systems, machinery, processes, and data analysis tools to streamline production processes. However, managing and monitoring the performance of automated systems requires more than just intuition—it requires key performance indicators (KPIs).
A Factory Automation KPI Dashboard serves as a powerful tool that helps manufacturers track, visualize, and analyze their operational performance in real-time. By focusing on the right KPIs, businesses can quickly identify areas for improvement and optimize their automation systems. This article will explore the essential KPIs for factory automation, the key features of a KPI dashboard, its advantages, and how businesses can use it to enhance production efficiency.
What is a Factory Automation KPI Dashboard?
A Factory Automation KPI Dashboard is a data visualization tool that consolidates key performance indicators (KPIs) into a centralized platform for easy tracking and analysis. This dashboard helps factory managers and decision-makers monitor critical aspects of automated production processes, including machine performance, downtime, energy consumption, and production output.
The dashboard provides a real-time overview of key metrics, allowing businesses to make data-driven decisions that improve production efficiency, reduce waste, and ensure smooth operation. By tracking performance over time, businesses can identify trends, optimize workflows, and minimize costly errors.
Key Features of the Factory Automation KPI Dashboard
The Factory Automation KPI Dashboard is designed to offer a comprehensive view of factory operations. Below are the key features that make it a powerful tool for manufacturers:
1. Home Sheet
The Home Sheet serves as the main navigation hub for the dashboard. It provides an overview of the key sections and allows users to quickly jump to the relevant worksheets. The home sheet includes six buttons, each linked to a specific section for easy access.
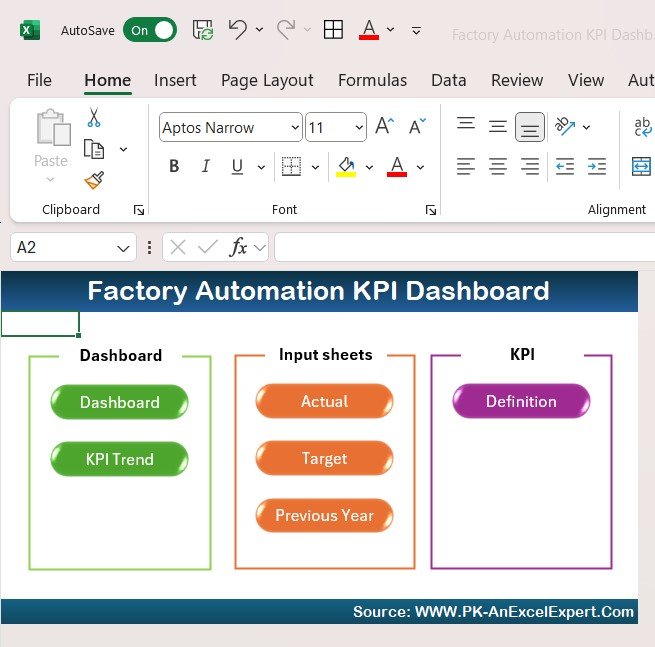
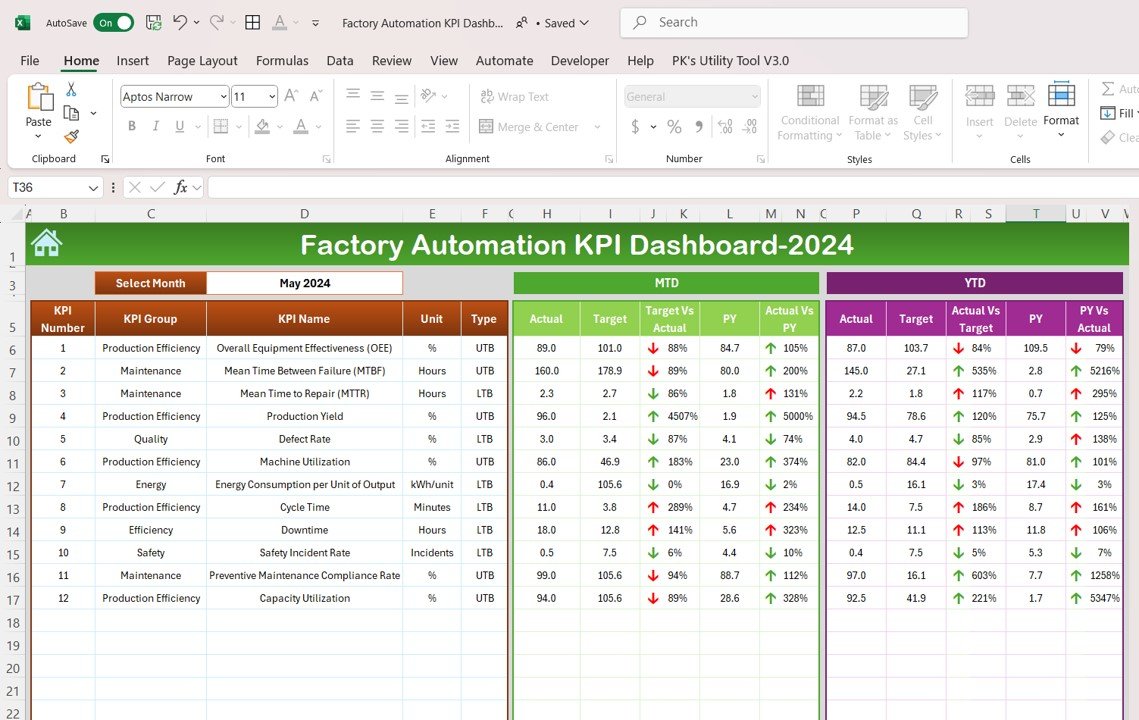
2. Dashboard Sheet Tab
The Dashboard Sheet Tab is the core of the KPI dashboard. Here, users can view all the key KPIs in a single interface. The dashboard allows users to select the desired month using a dropdown menu (Range D3), and all data updates automatically to reflect the selected month.
Key metrics such as MTD (Month-to-Date) and YTD (Year-to-Date) data are displayed, along with target vs. actual performance, previous year comparisons, and conditional formatting that highlights performance with up/down arrows.
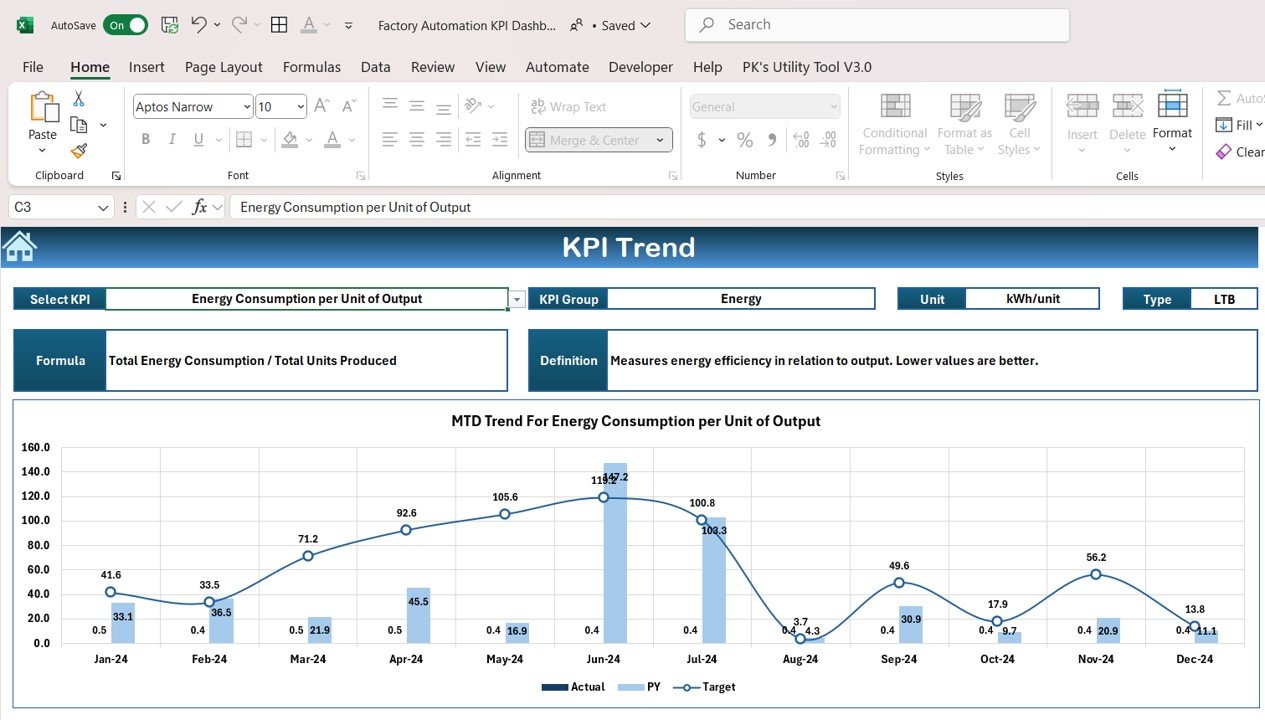
3. KPI Trend Sheet Tab
The KPI Trend Sheet Tab allows users to track the historical performance of specific KPIs. By selecting a KPI from the dropdown (Range C3), users can view key data such as the KPI group, unit of measurement, and whether the KPI is “Lower the Better” or “Upper the Better.” This sheet also provides the formula for calculating each KPI, along with a definition.
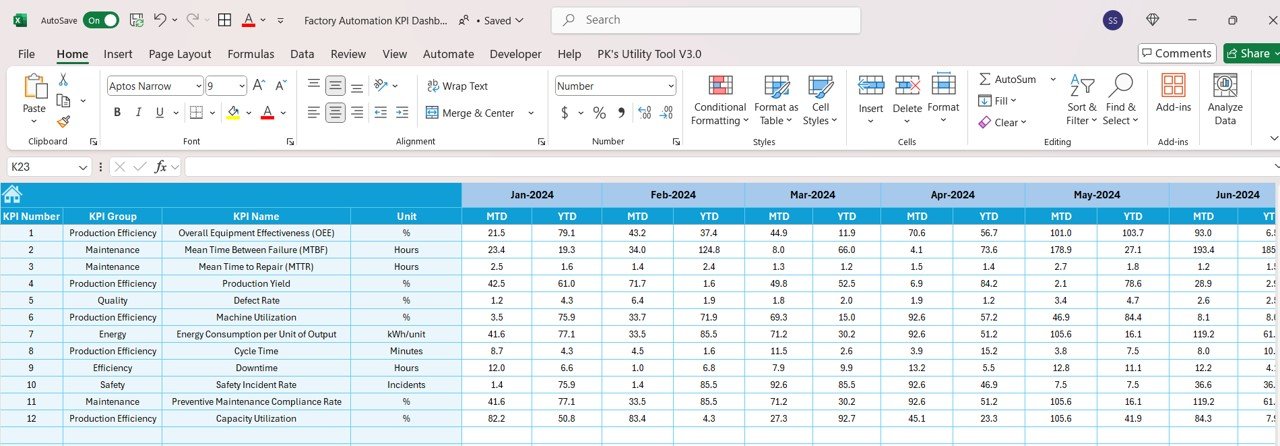
4. Actual Number Sheet Tab
In this tab, users input the actual performance data for each KPI, both for YTD and MTD. The month can be updated easily by changing the value in Range E1. The sheet automatically adjusts the data for the selected month.
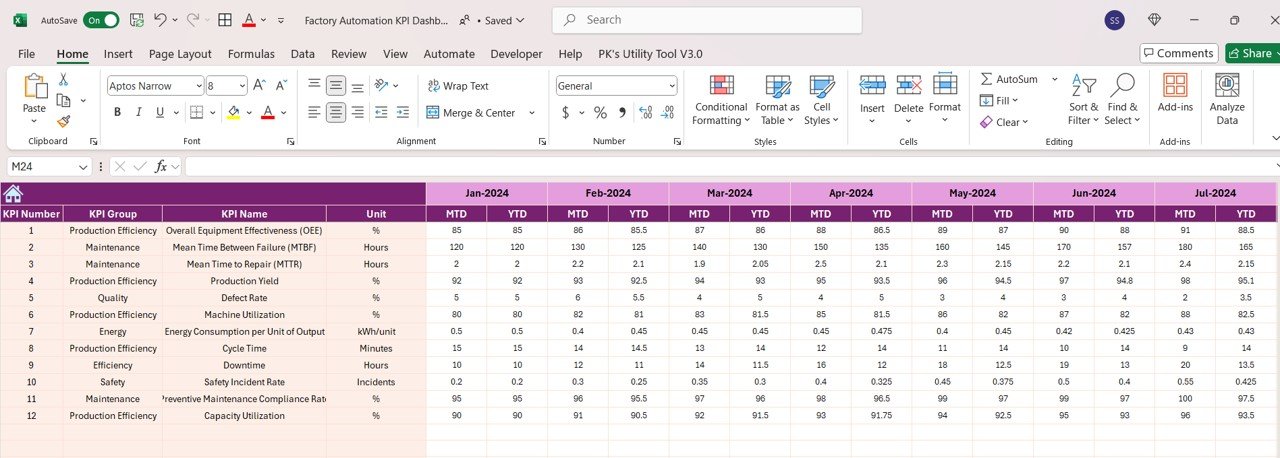
5. Target Sheet Tab
The Target Sheet enables users to enter target numbers for each KPI, both on a monthly and yearly basis (MTD and YTD). This helps businesses set realistic goals and benchmarks for automation performance.
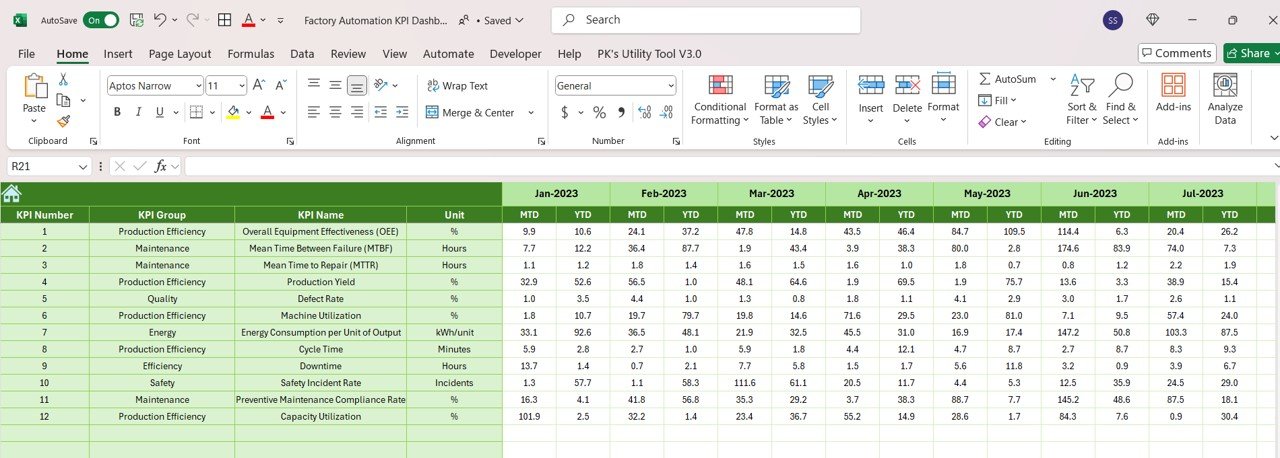
6. Previous Year Number Sheet Tab
This sheet allows users to input the data from the previous year to compare it with the current year’s performance. This comparison helps businesses identify trends, evaluate growth, and pinpoint areas for improvement.
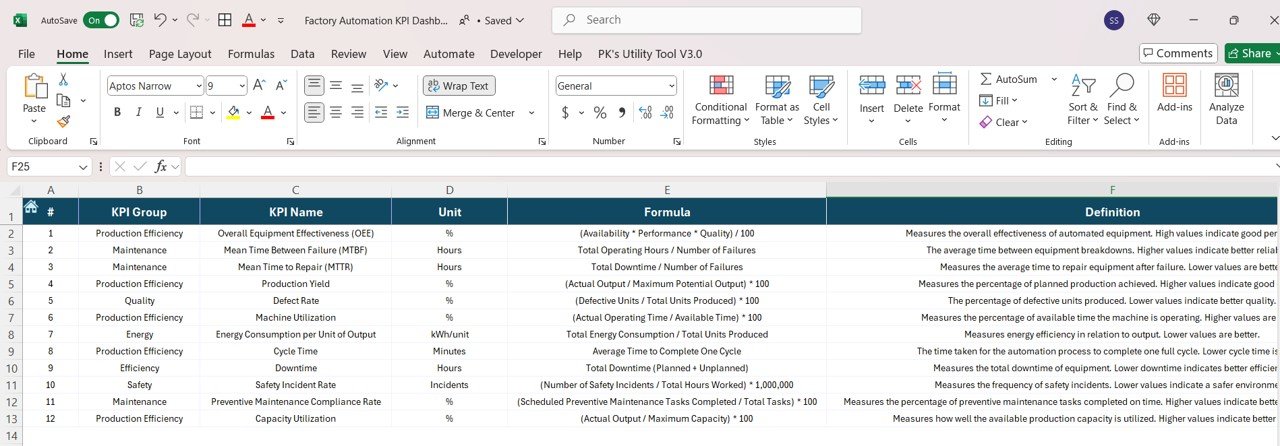
7. KPI Definition Sheet Tab
The KPI Definition Sheet provides a standardized definition for each KPI. It includes essential details such as the KPI name, group, unit of measure, formula, and a clear definition of what the KPI represents. This sheet ensures that all team members understand the KPIs and how they are calculated.
Advantages of Using a Factory Automation KPI Dashboard
Implementing a Factory Automation KPI Dashboard offers several significant advantages that can help businesses optimize their manufacturing processes and improve operational efficiency. Here are some of the key benefits:
- Real-Time Monitoring: A well-designed KPI dashboard provides real-time performance data, allowing businesses to continuously track operations and spot issues before they escalate.
- Informed Decision-Making: With access to accurate and up-to-date data, businesses can make better decisions about production, resource allocation, and optimization strategies.
- Cost Reduction: By tracking key metrics such as energy consumption, downtime, and maintenance costs, businesses can identify areas to cut costs, improve resource utilization, and reduce waste.
- Improved Operational Efficiency: By focusing on KPIs like production rate, changeover time, and labor productivity, manufacturers can enhance their operational efficiency and minimize production bottlenecks.
- Increased Product Quality: Tracking quality control KPIs such as defects per unit ensures that product quality standards are consistently met, reducing the need for rework and improving customer satisfaction.
Opportunity to Improve the Factory Automation KPI Dashboard
While the Factory Automation KPI Dashboard provides valuable insights, there are always opportunities to enhance its functionality and impact. Here are some potential improvements:
- Data Integration: Incorporating data from other systems such as ERP, CRM, or SCADA can provide a more comprehensive view of factory performance, integrating supply chain, production, and customer data.
- Predictive Analytics: Integrating predictive analytics tools can help forecast equipment failures, production delays, and demand spikes, enabling businesses to take proactive measures.
- Mobile Access: Developing a mobile-friendly version of the dashboard can allow factory managers and staff to access critical performance data from anywhere, improving flexibility and responsiveness.
Best Practices for Using the Factory Automation KPI Dashboard
To maximize the effectiveness of the Factory Automation KPI Dashboard, it’s essential to follow certain best practices:
- Regularly Update the Dashboard: Ensure that the dashboard is updated with the most current data to provide the most accurate insights for decision-making.
- Focus on Relevant KPIs: Avoid cluttering the dashboard with too many metrics. Instead, focus on KPIs that directly impact operational efficiency and bottom-line performance.
- Continuous User Training: Train all relevant team members on how to interpret and use the dashboard effectively. Well-informed users will be able to maximize the dashboard’s potential.
Frequently Asked Questions (FAQs)
1. What are the key KPIs to track for factory automation?
Key KPIs include production rate, machine downtime, energy consumption per unit, labor productivity, and overall equipment effectiveness (OEE).
2. How often should I update the Factory Automation KPI Dashboard?
The dashboard should be updated regularly, ideally in real-time, to ensure the data is accurate and provides the most relevant insights for decision-making.
3. Can I integrate other data sources into the Factory Automation KPI Dashboard?
Yes, integrating data from systems like ERP, SCADA, and CRM can provide a more holistic view of factory performance.
4. How can the KPI dashboard help reduce costs in factory automation?
By tracking KPIs such as maintenance costs, energy consumption, and downtime, businesses can identify inefficiencies and implement strategies to reduce costs.
5. What are the benefits of tracking sustainability KPIs in factory automation?
Tracking sustainability KPIs like waste percentage helps reduce waste material, promote eco-friendly practices, and improve the factory’s environmental footprint.
Conclusion:
The Factory Automation KPI Dashboard is an essential tool for manufacturers looking to optimize their production processes, reduce costs, and improve product quality. By monitoring key metrics such as machine performance, energy consumption, and maintenance costs, businesses can gain valuable insights that lead to better decision-making. With real-time data and predictive analytics, this dashboard empowers businesses to enhance operational efficiency and stay ahead in the competitive market.
Visit our YouTube channel to learn step-by-step video tutorials
View this post on Instagram