In the modern business world, staying ahead of your inventory and finances is not just helpful—it’s absolutely essential. And when you blend inventory control with financial accuracy, you’re unlocking a powerhouse of insights. That’s where the Finance and Accounting Inventory Management KPI Dashboard in Excel comes into play.
This comprehensive dashboard is designed to help businesses track and analyze key performance indicators (KPIs) related to inventory and financial efficiency. In this article, you will learn everything you need to know about this dashboard—its structure, advantages, best practices, and frequently asked questions.
Click to Purchases Finance and Accounting Inventory Management KPI Dashboard in Excel
What is the Finance and Accounting Inventory Management KPI Dashboard?
The Finance and Accounting Inventory Management KPI Dashboard in Excel is a dynamic and interactive tool designed to help finance teams and inventory managers keep track of crucial metrics. It ensures that inventory levels align with financial goals, while enabling real-time performance tracking through visual dashboards.
Built entirely in Microsoft Excel, this template is easy to use, highly customizable, and perfect for small businesses, accounting professionals, and supply chain teams.
Key Features of the Dashboard
This dashboard is structured with 7 worksheet tabs, each serving a specific purpose:
Home Sheet
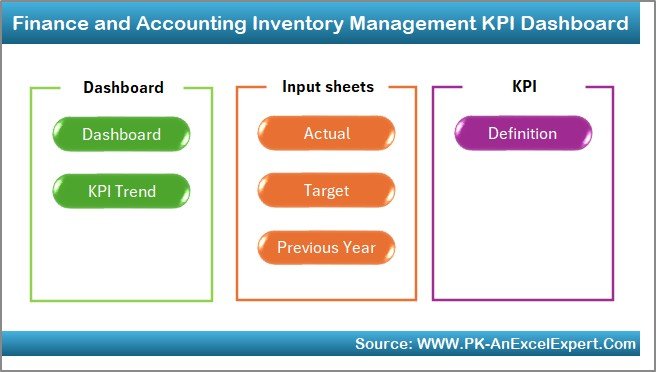
- Acts as the index or navigation center.
- Provides 6 buttons to jump directly to individual sheets.
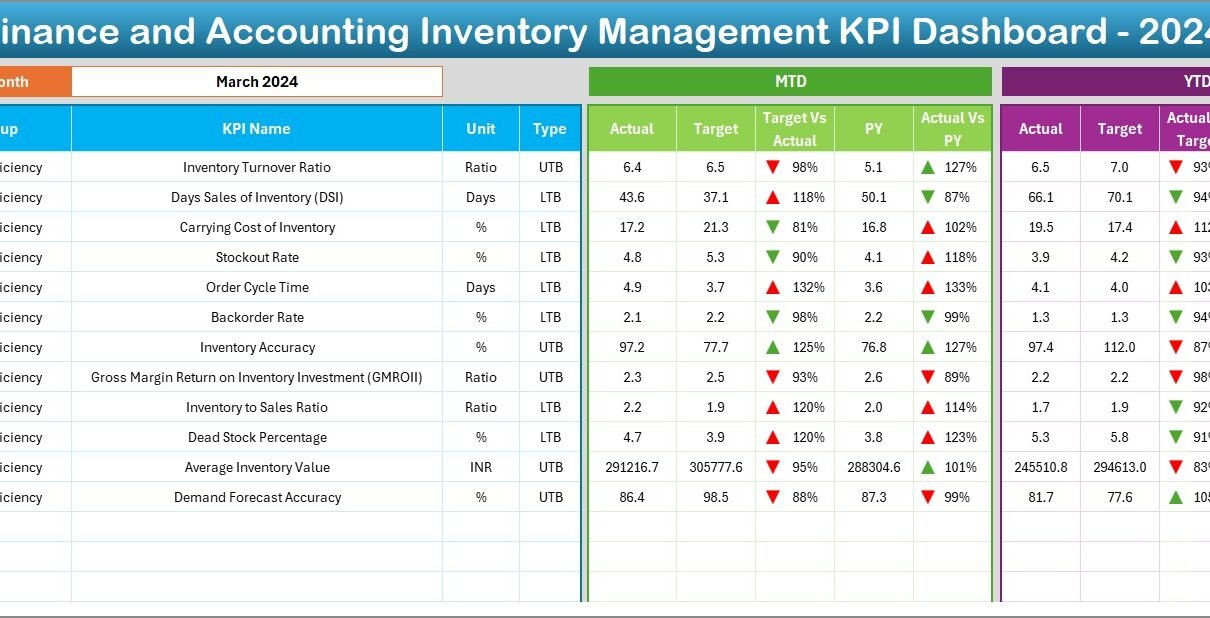
Dashboard Sheet Tab
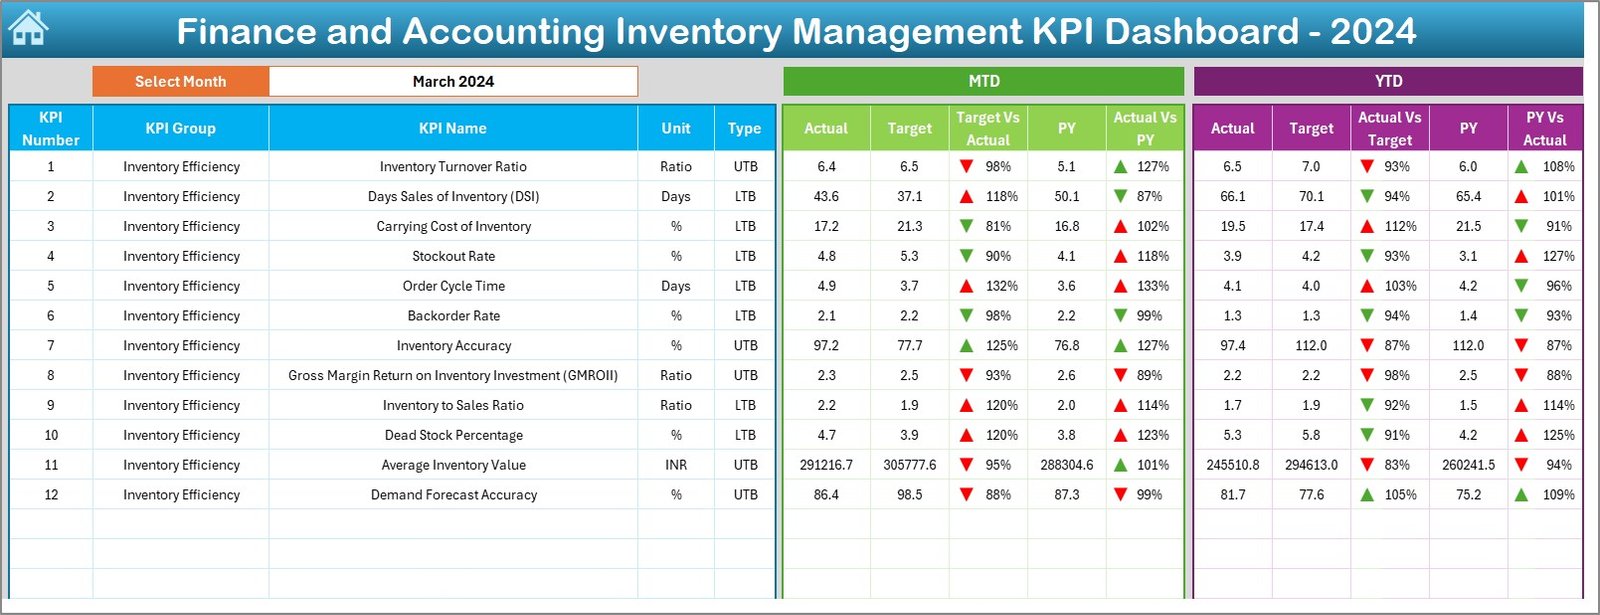
- Main visual reporting section.
- Select month via drop-down at cell D3 to view updated figures.
- Shows MTD (Month-to-Date) and YTD (Year-to-Date) actuals, targets, and comparisons with the previous year.
- Conditional formatting highlights performance using arrows.
KPI Trend Sheet Tab
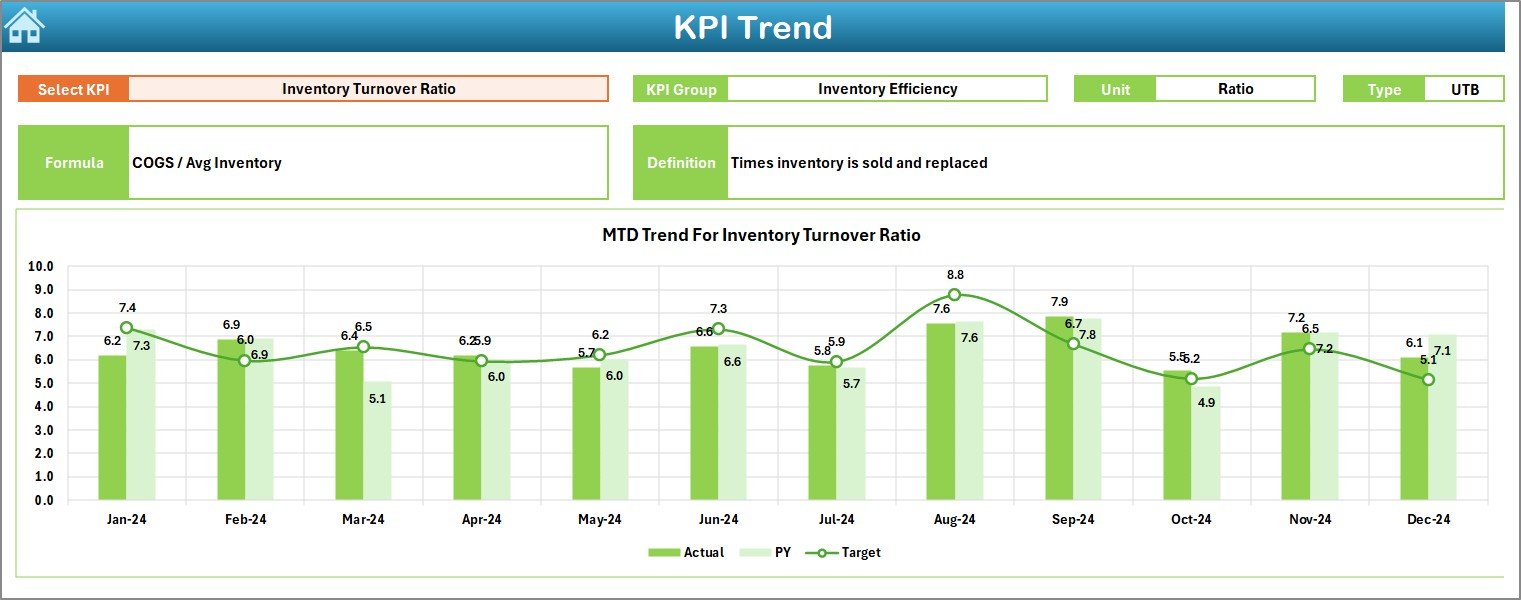
- Dropdown in C3 to select any KPI.
- Displays KPI Group, Unit, Formula, and Type (UTB or LTB).
- Includes MTD and YTD trend charts for Actual, Target, and Previous Year.
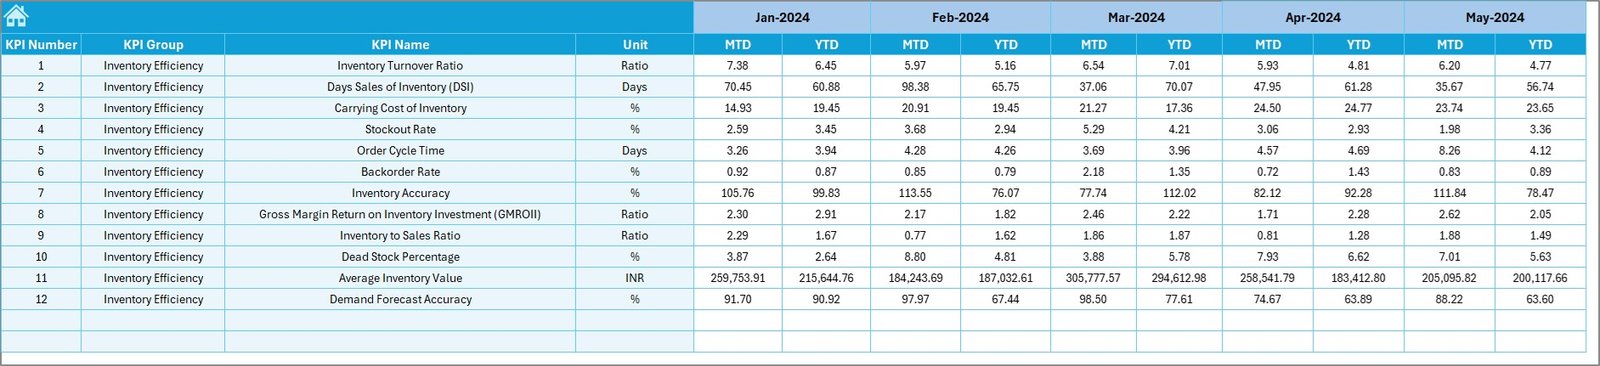
Actual Numbers Input Sheet
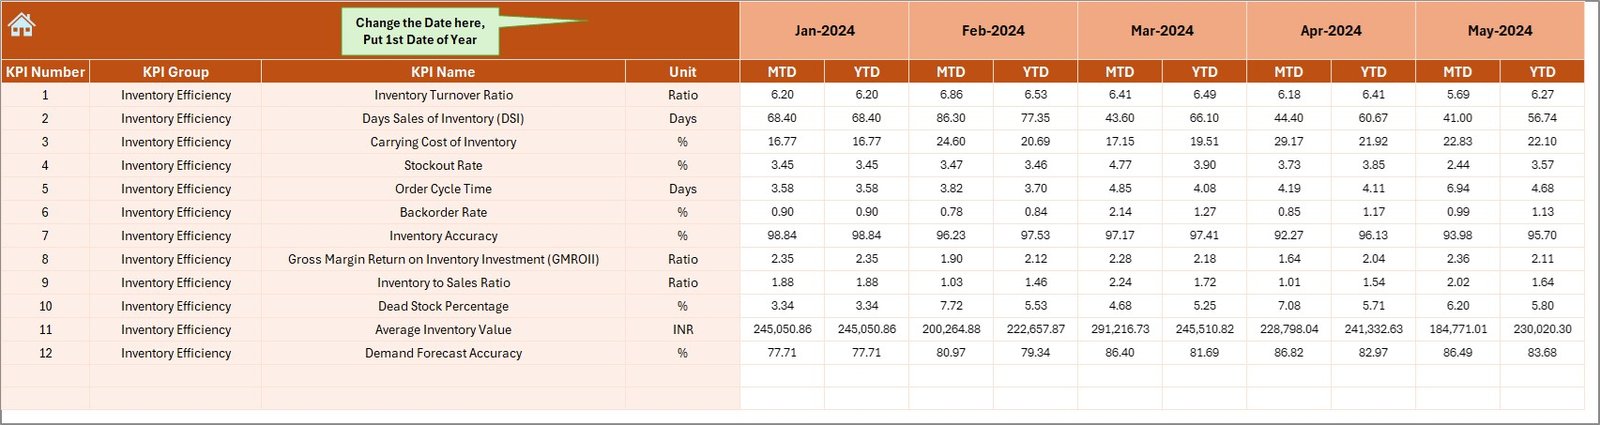
- Users input actual MTD and YTD figures.
- Cell E1 sets the starting month of the year.
Target Sheet Tab
- Enter monthly MTD and YTD targets for each KPI.
Previous Year Numbers Sheet Tab
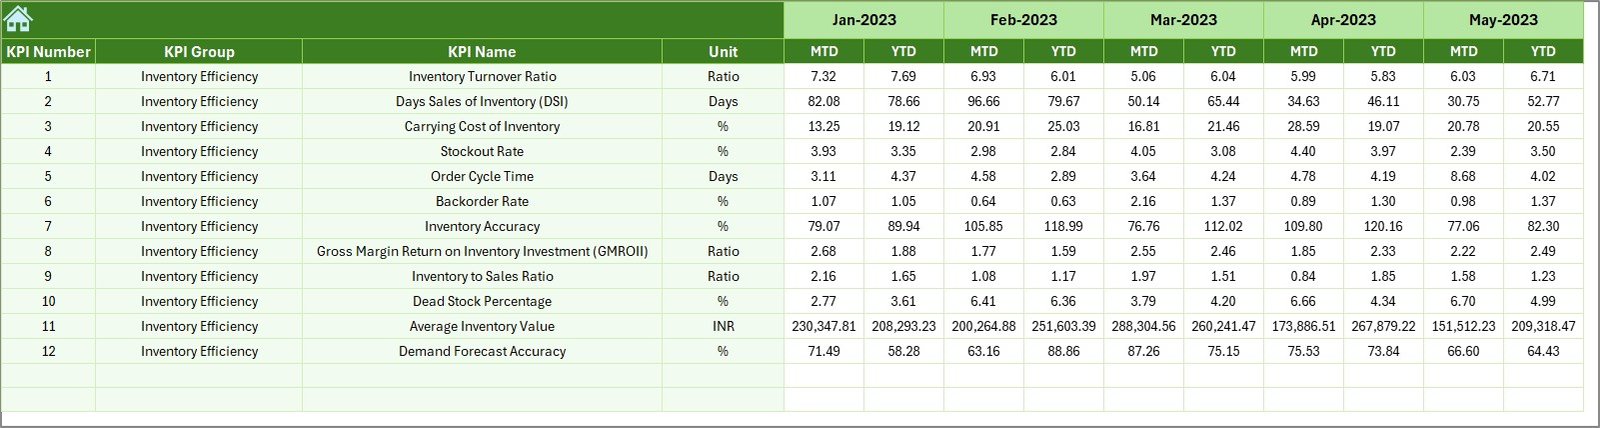
- Historical comparison using same data structure as the current year.
KPI Definition Sheet Tab
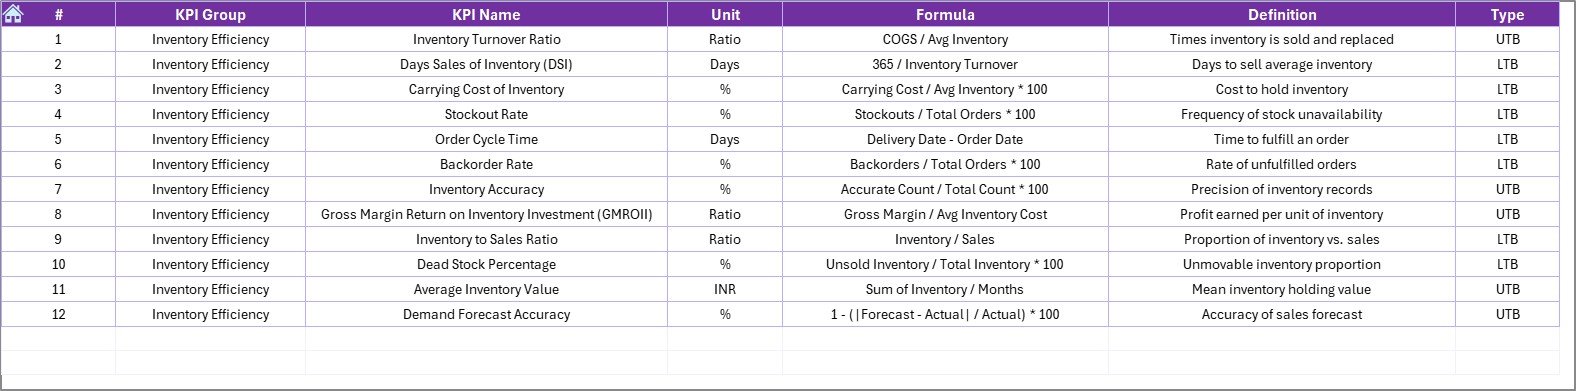
- Includes KPI Name, Group, Unit, Formula, and short Definition.
Why is This Dashboard Important?
Inventory and finance are deeply connected. Mismanaged inventory affects working capital, cash flow, and overall profitability. With this dashboard:
- You reduce overstocking and understocking.
- You ensure timely reorder and prevent stock-outs.
- You track financial efficiency related to inventory like carrying costs, shrinkage, and turnover.
Click to Purchases Finance and Accounting Inventory Management KPI Dashboard in Excel
Advantages of Finance and Accounting Inventory Management KPI Dashboard
📊 Real-Time Performance Monitoring
Track MTD and YTD KPIs in a visual, easy-to-understand format.
🌟 Enhanced Decision Making
Get immediate feedback on how well inventory performance aligns with financial targets.
🔄 Historical Comparisons
Use PY (Previous Year) data for benchmarking progress.
🔧 Customization Flexibility
Modify KPIs, formulas, and visual formats based on your needs.
✅ Better Accuracy
Centralized entry of actual, target, and PY data improves consistency.
📊 Trend Analysis
Use built-in charts to quickly spot performance spikes or dips over months.
Best Practices for Using the KPI Dashboard
To make the most of this Excel-based dashboard, follow these best practices:
- Keep Data Updated Regularly
Update actual and target data every month without fail. It keeps the dashboard accurate and useful.
- Involve Finance and Inventory Teams Together
Let both teams collaborate to align operational goals with financial targets.
- Use Consistent Units and Formats
Ensure that all KPIs are entered in the same unit format. Consistency avoids confusion.
- Use Short and Clear KPI Definitions
Every KPI should have a clear definition so that users understand its purpose instantly.
- Apply Conditional Formatting Thoughtfully
Use up/down arrows and color coding to highlight areas that need immediate attention.
Examples of Inventory Management KPIs You Can Track
Here are common KPIs often included in this dashboard:
- Inventory Turnover Ratio: Measures how many times inventory is sold and replaced.
- Days Inventory Outstanding (DIO): Indicates the average number of days inventory stays in stock.
- Carrying Cost of Inventory: Tracks total cost related to storing unsold goods.
- Stockout Rate: Shows frequency of stock unavailability.
- Order Cycle Time: Time between placing and receiving an order.
- Shrinkage Rate: Percentage of inventory loss due to theft or error.
- Gross Margin Return on Investment (GMROI): Profitability per inventory unit.
- Backorder Rate: Measures demand not fulfilled at the time of order.
- Inventory to Sales Ratio: Evaluates balance between inventory and sales.
- Cost of Goods Sold (COGS): Direct cost of producing sold items.
Who Can Use This Dashboard?
This Excel dashboard is designed for a wide range of users:
- 📈 Finance Managers
- 🧱 Inventory and Warehouse Teams
- 💼 Business Analysts
- 📆 Supply Chain Professionals
- 🌍 Small Business Owners
Whether you’re tracking warehouse efficiency or evaluating your cost control strategies, this dashboard serves as your go-to tool.
Conclusion
The Finance and Accounting Inventory Management KPI Dashboard in Excel offers a powerful, yet simple way to bridge the gap between inventory performance and financial accountability. It lets you take control of your metrics, understand patterns, and make informed decisions that lead to better outcomes.
From tracking inventory turns to visualizing year-over-year improvements, this tool empowers you to do more with your data. So why wait? Start managing your inventory the smart way—with Excel.
Frequently Asked Questions (FAQs)
What KPIs are included in the dashboard?
Some of the key KPIs include Inventory Turnover Ratio, DIO, Shrinkage Rate, Stockout Rate, and Carrying Cost of Inventory.
Can I add or remove KPIs from the dashboard?
Yes, the dashboard is fully customizable. You can add or remove KPIs based on your organization’s requirements.
Is this dashboard suitable for small businesses?
Absolutely! The dashboard is ideal for small to mid-sized businesses that want real-time control over their inventory and financial KPIs.
What software do I need to use this dashboard?
You only need Microsoft Excel (2016 or later recommended) to use and modify this dashboard.
Click to Purchases Finance and Accounting Inventory Management KPI Dashboard in Excel
Visit our YouTube channel to learn step-by-step video tutorials