
Are you managing the growth of your finance and accounting functions and looking for a smart, visual way to monitor expansion? If yes, then you need to explore the power of the Finance and Accounting Market Expansion KPI Dashboard in Excel. This easy-to-use, interactive Excel dashboard helps you track your key performance indicators (KPIs) in one place. Whether you’re a finance lead, accountant, or business analyst, this tool gives you real-time insights into your market performance.
Let’s dive into the complete details of this KPI dashboard and explore how it can help you expand your financial market operations efficiently.
Click to Purchases Finance and Accounting Market Expansion KPI Dashboard in Excel
What is a Finance and Accounting Market Expansion KPI Dashboard?
A Finance and Accounting Market Expansion KPI Dashboard is a dynamic Excel-based dashboard designed to track the most important KPIs related to financial market growth. It provides a clear, at-a-glance view of your performance, making it easier to identify strengths, weaknesses, and new opportunities.
It helps stakeholders answer key questions such as:
- Are we hitting our monthly targets?
- How do this year’s numbers compare to last year’s?
- What are the trends across key financial metrics?
This dashboard simplifies analysis and encourages data-driven decision-making.
Key Features of the KPI Dashboard
This Excel dashboard includes 7 professionally designed worksheet tabs, each serving a specific function:
Home Sheet
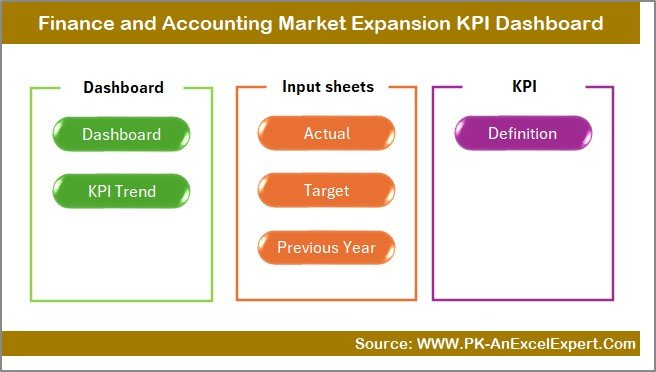
- Acts as the navigation hub.
- Includes 6 clickable buttons to jump to other sheets instantly.
- Simple and clean interface to guide the user.
Dashboard Sheet Tab
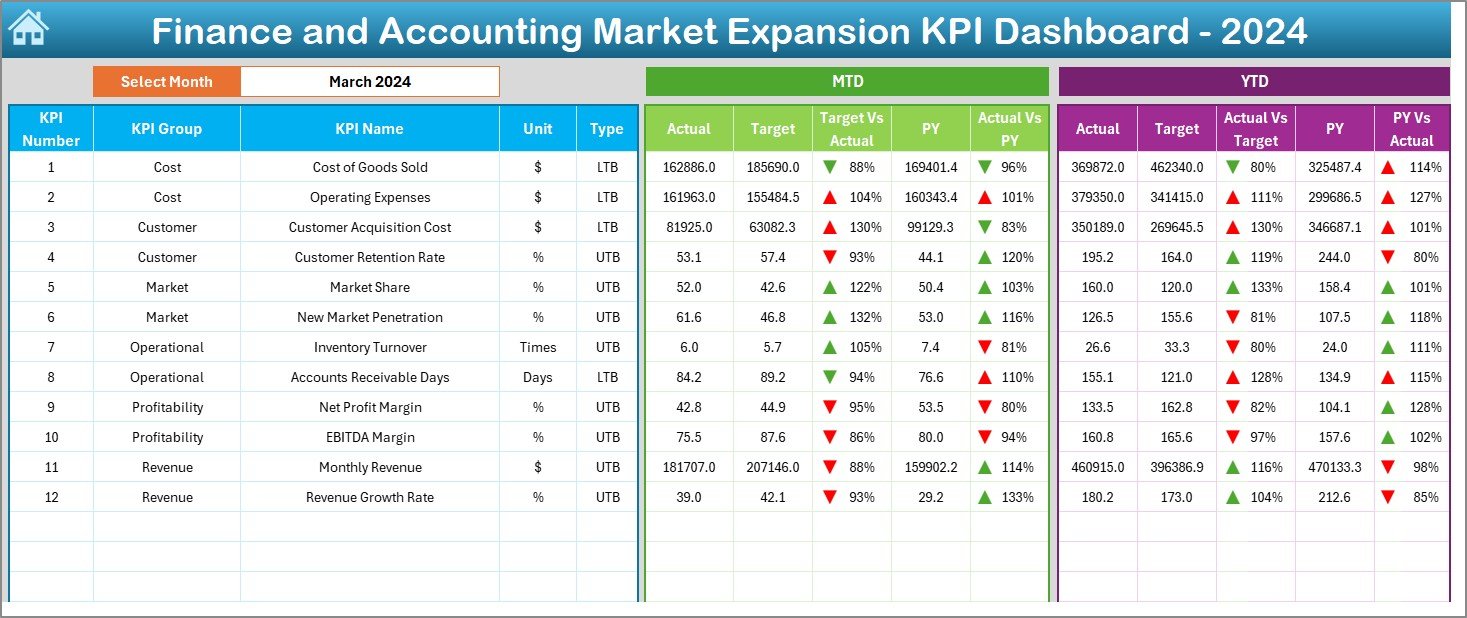
- This is the core visual analytics sheet.
- You can select the month from the drop-down in cell D3.
- Automatically updates all KPI charts and metrics for the selected month.
- Includes:
- MTD (Month-to-Date) Actual vs Target vs Previous Year (PY)
- YTD (Year-to-Date) Actual vs Target vs PY
- Conditional formatting with arrows for easy interpretation
KPI Trend Sheet Tab
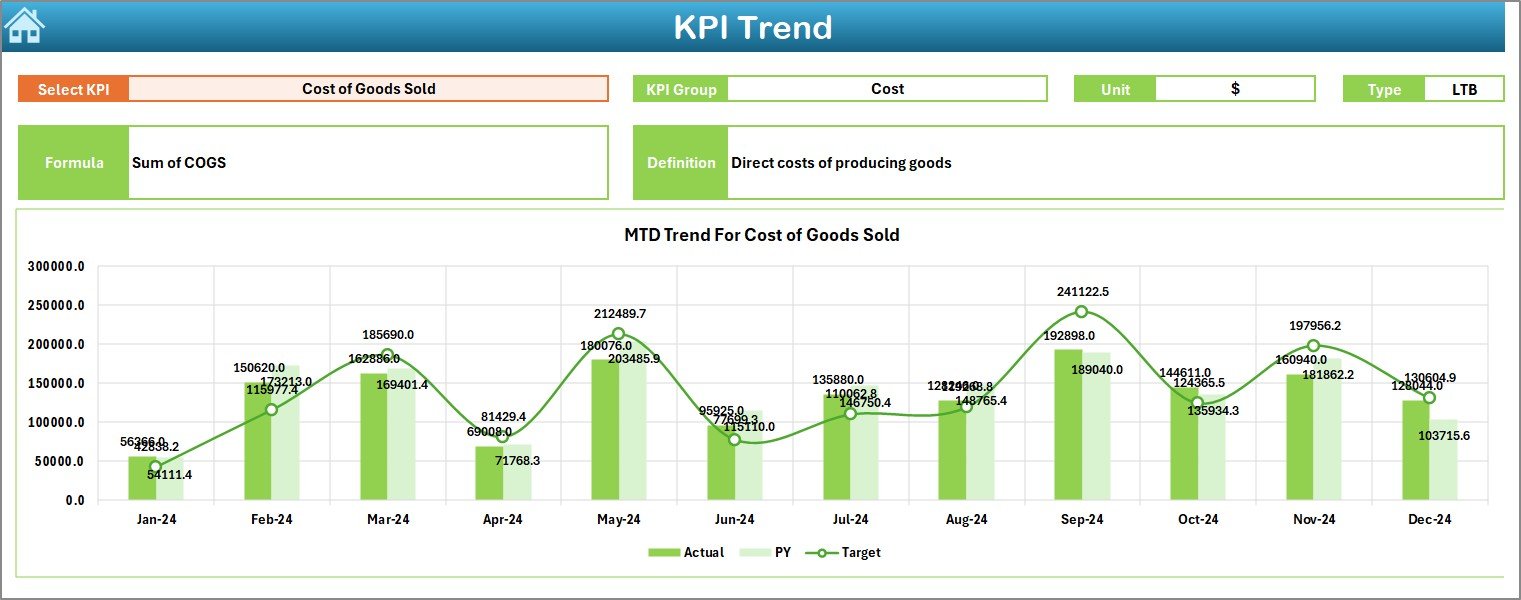
- Choose a KPI from the drop-down in cell C3.
- View its group, unit, type (LTB/UTB), formula, and definition.
- MTD and YTD trends are displayed as interactive charts for easy comparison.
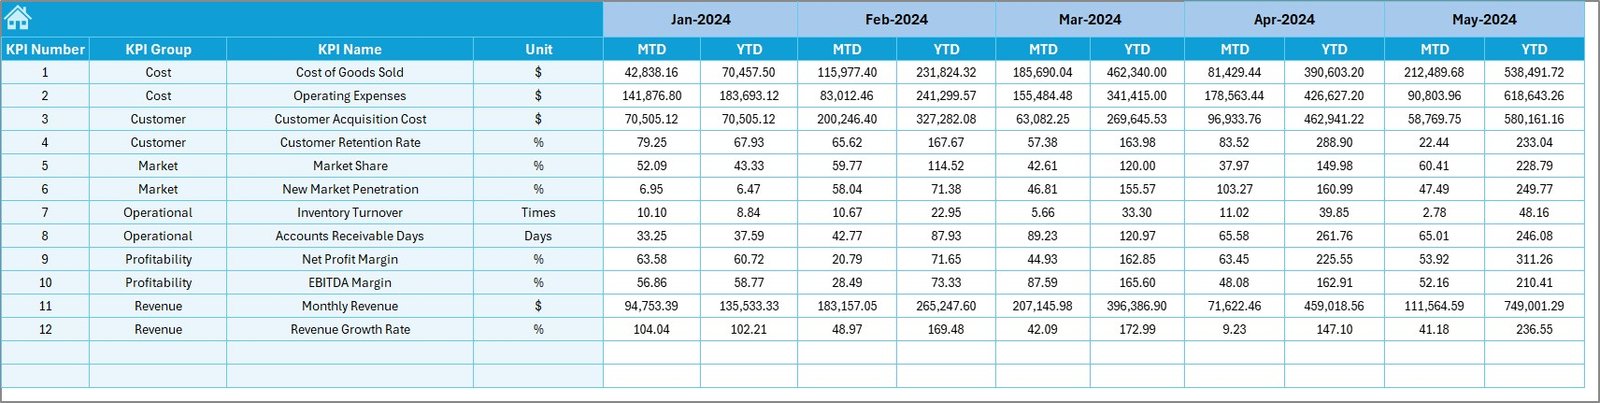
Actual Numbers Input Sheet
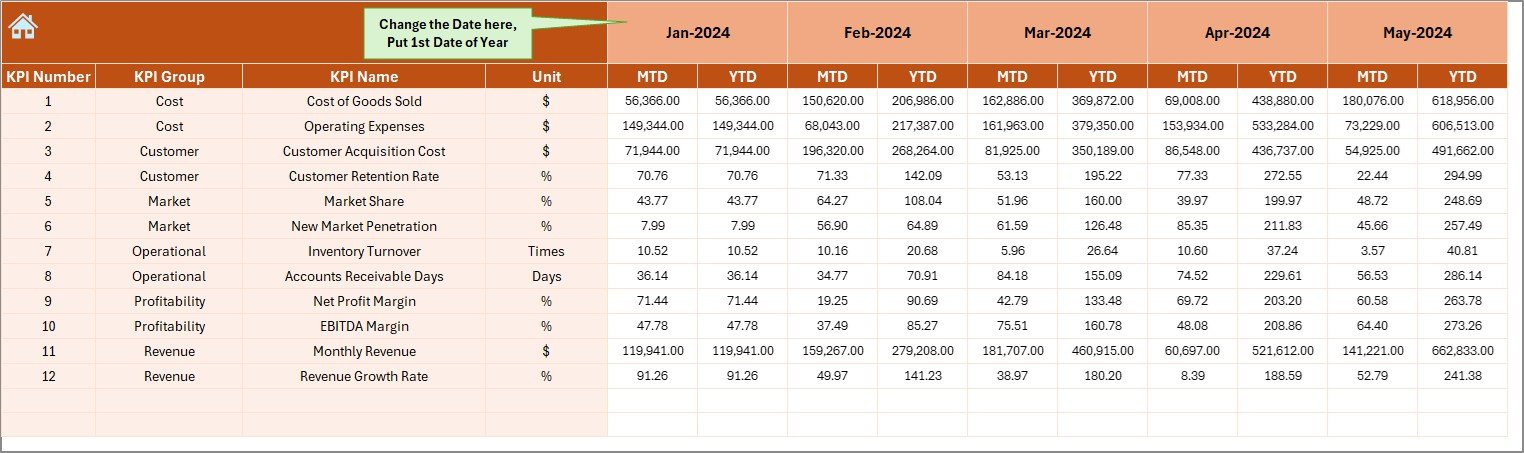
- Input your current MTD and YTD figures for each KPI.
- Change the first month of the year in cell E1 to align your data.
Target Sheet Tab
- Enter monthly MTD and YTD targets for each KPI.
- Ensures benchmarks are clearly defined and tracked.
Previous Year Numbers Sheet
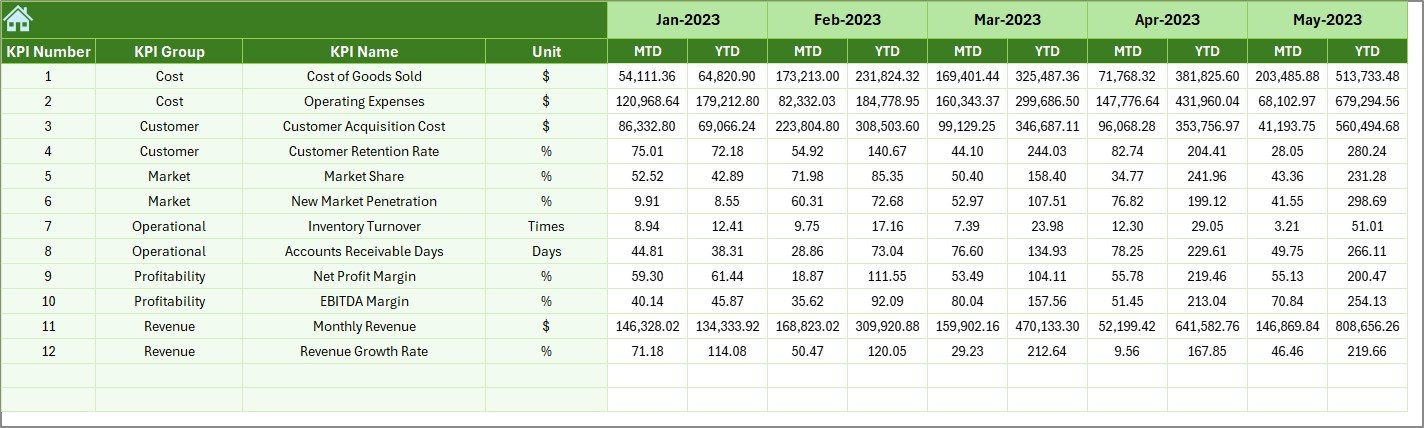
- Input historical data from the previous year.
- Enables year-over-year comparison.
KPI Definition Sheet Tab
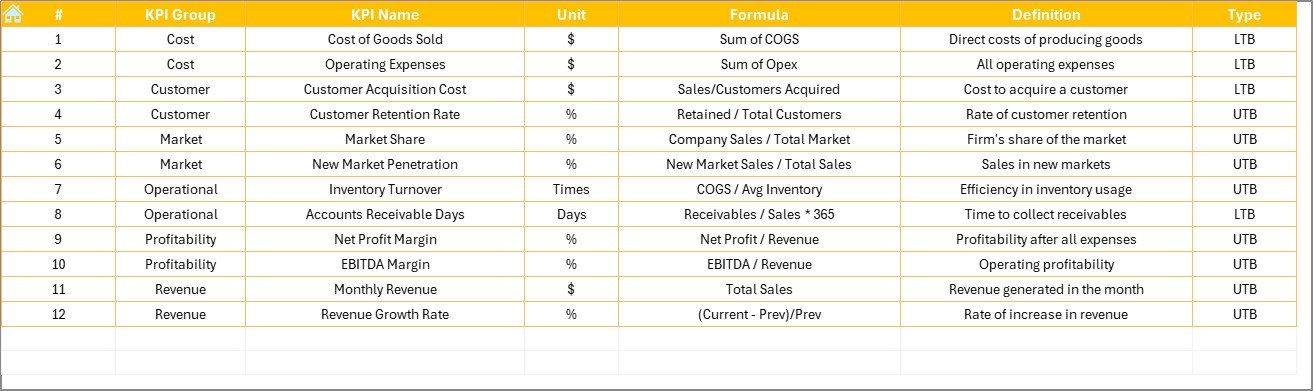
- Define each KPI here, including:
- KPI Name
- Group
- Unit
- Formula
- Short definition
- Acts as a reference sheet for all users.
Click to Purchases Finance and Accounting Market Expansion KPI Dashboard in Excel
Advantages of Using This Dashboard
📊 Improved Decision-Making
You can spot market trends and compare targets vs actuals without sifting through multiple spreadsheets.
📆 Time-Saving Automation
The drop-down selections and auto-updating charts save hours of manual work.
🌐 Better Team Communication
Everyone from the finance team to senior leaders sees the same clear, visual insights.
💸 Focused Financial Planning
Since you get to track YTD and MTD trends, it helps you plan budgets and forecasts more accurately.
Best Practices for Using This KPI Dashboard
To make the most of this dashboard, follow these best practices:
Keep Your Data Updated Monthly
Regularly update the Actuals, Targets, and Previous Year tabs. This keeps your reports fresh and relevant.
Train Your Team to Use It
Make sure your finance team understands how to use drop-downs, update input sheets, and interpret the dashboard charts.
Standardize KPI Definitions
Ensure your KPI definitions are short, clear, and aligned with your business objectives.
Use Conditional Formatting Wisely
Rely on arrows and color codes to communicate insights instantly without needing complex interpretations.
Review Trends Quarterly
Use the KPI Trend sheet to identify whether your market expansion strategies are working. This helps in timely course correction.
Who Can Use This Dashboard?
This dashboard template works perfectly for:
- Finance Teams
- Account Managers
- CFOs and Controllers
- Market Analysts
- Small to Medium Business Owners
- Financial Consultants
Anyone looking to understand and improve financial market expansion performance can benefit from this.
What KPIs Can You Track?
Here are a few example KPIs you can track in this dashboard:
- Revenue Growth % (UTB)
- Market Penetration Rate (UTB)
- Customer Acquisition Cost (LTB)
- Net Profit Margin % (UTB)
- Operating Expense Ratio (LTB)
- Return on Investment (UTB)
- Accounts Receivable Turnover (UTB)
- Sales Conversion Rate (UTB)
Each KPI includes a short formula, unit (e.g., %, ratio), and its trend.
Why Should You Use Excel for This Dashboard?
Many ask: Why Excel? Isn’t there software for this? Well, Excel remains:
- Highly customizable
- Easily shareable
- Cost-effective
- Widely adopted across organizations
You can also embed formulas, charts, slicers, and conditional formatting without any external tools.
Real-Time Monitoring = Real Business Growth
When you monitor your KPIs in real-time, you react faster. Whether you need to ramp up hiring or adjust your market strategy, this dashboard gives you a clear picture to act on.
No more second-guessing. This Excel template helps you make smart, confident decisions backed by numbers.
Conclusion
The Finance and Accounting Market Expansion KPI Dashboard in Excel is your all-in-one solution to monitor, analyze, and act on critical business insights. It keeps your team aligned, simplifies decision-making, and enhances your financial visibility. Whether you manage one region or multiple markets, this dashboard helps you scale with confidence.
Start using it today and take your finance team to the next level.
Frequently Asked Questions (FAQs)
❓ What is the main benefit of using this dashboard?
It centralizes all your KPI tracking in one place, making it easier to monitor and manage your financial growth.
❓ Can I customize the KPIs?
Yes, you can fully customize all KPI names, formulas, targets, and units in the KPI Definition sheet.
❓ Do I need advanced Excel skills to use this?
Not at all. Basic Excel knowledge is enough. Most functions work with drop-downs and input fields.
❓ How often should I update the dashboard?
Update it monthly for best results. You can also review quarterly trends for deeper insights.
Click to Purchases Finance and Accounting Market Expansion KPI Dashboard in Excel
Visit our YouTube channel to learn step-by-step video tutorials
Watch the step-by-step video Demo:


