In today’s dynamic business environment, sustainability has become a core pillar of finance and accounting. Companies are increasingly being held accountable not only for financial outcomes but also for their environmental and social impact. This is exactly where a Finance and Accounting Sustainability KPI Dashboard in Excel becomes an essential tool. It allows organizations to track, analyze, and optimize key sustainability metrics alongside traditional financial KPIs.
Let’s dive into a comprehensive, step-by-step guide to what this dashboard offers, how to use it effectively, and why it matters so much in today’s financial landscape.
Click to Purchases Finance and Accounting Sustainability KPI Dashboard in Excel
What is a Finance and Accounting Sustainability KPI Dashboard?
A Finance and Accounting Sustainability KPI Dashboard is an Excel-based tool that helps finance professionals monitor and report on both financial and sustainability performance. It consolidates data from various departments and transforms it into insightful visuals, enabling decision-makers to understand trends, compare actuals vs. targets, and measure progress over time.
This kind of dashboard is especially useful in:
- Monitoring resource efficiency
- Tracking financial and environmental metrics
- Ensuring compliance with sustainability reporting frameworks
- Aligning performance with corporate sustainability goals
Key Features of the Dashboard
This Excel template includes 7 powerful worksheet tabs that make sustainability reporting easier and more efficient:
Home Sheet
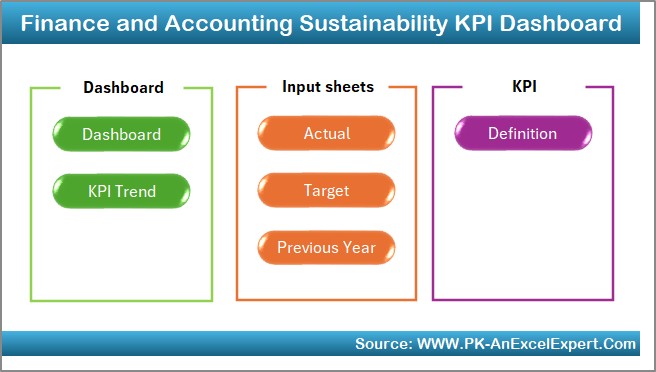
- Serves as the navigation hub
- Includes 6 buttons for quick access to each worksheet
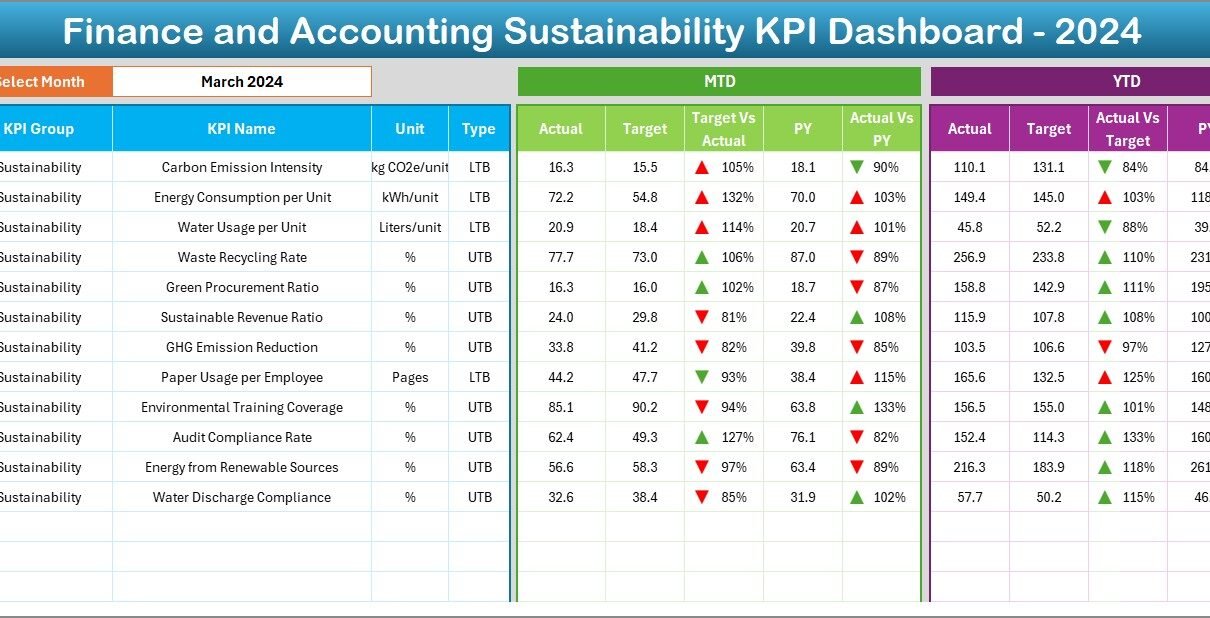
Dashboard Sheet
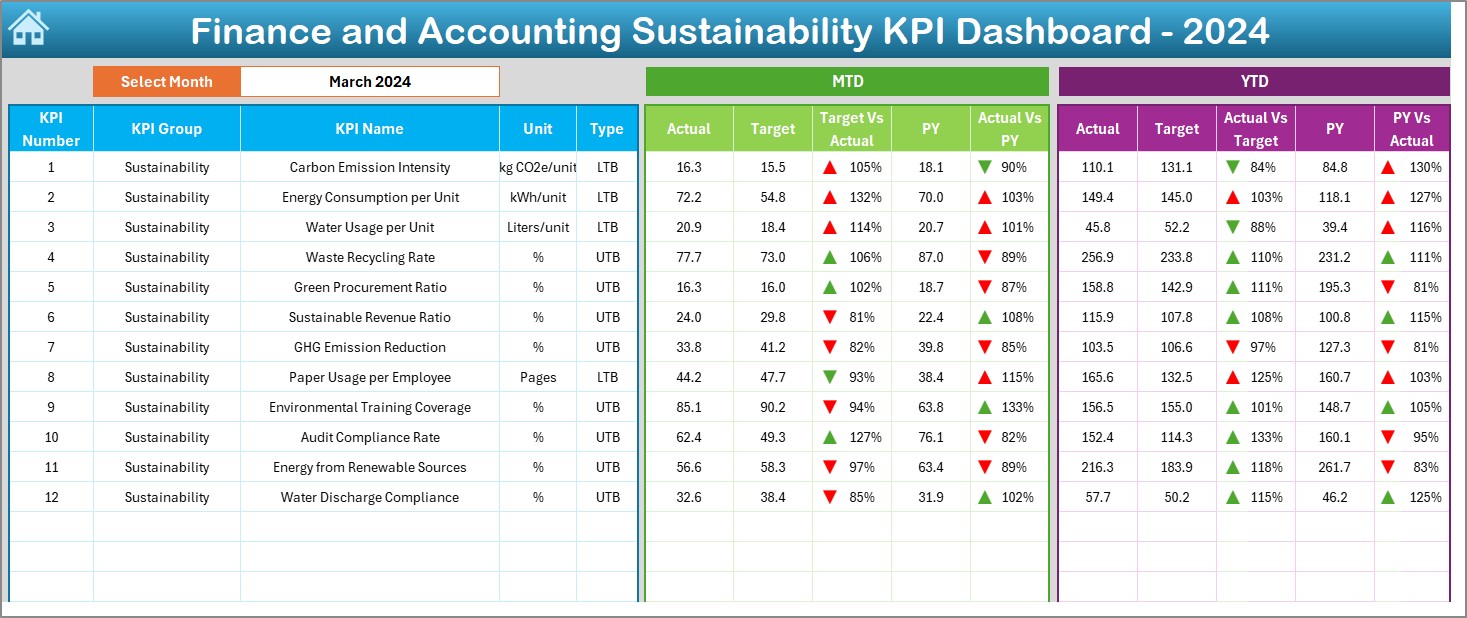
- Central visual space where KPIs are displayed
- Month selection through drop-down (Range D3)
- Shows:
- MTD (Month-to-Date) Actual, Target, and Previous Year (PY)
- YTD (Year-to-Date) Actual, Target, and PY
- Up/down arrows with conditional formatting to quickly assess performance
KPI Trend Sheet
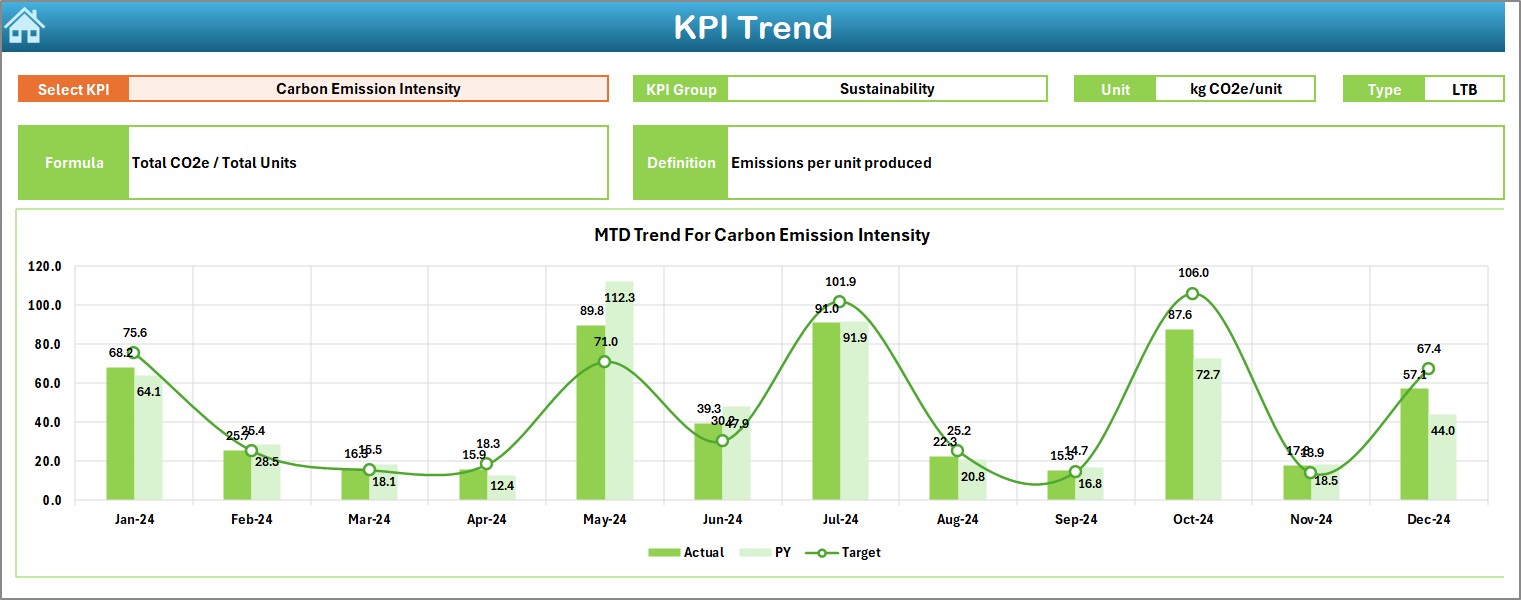
- Dynamic charts showing trends over months
- Drop-down in Range C3 lets users select a KPI
- Displays KPI Group, Unit, Type (UTB or LTB), Formula, and Definition
Actual Numbers Input Sheet
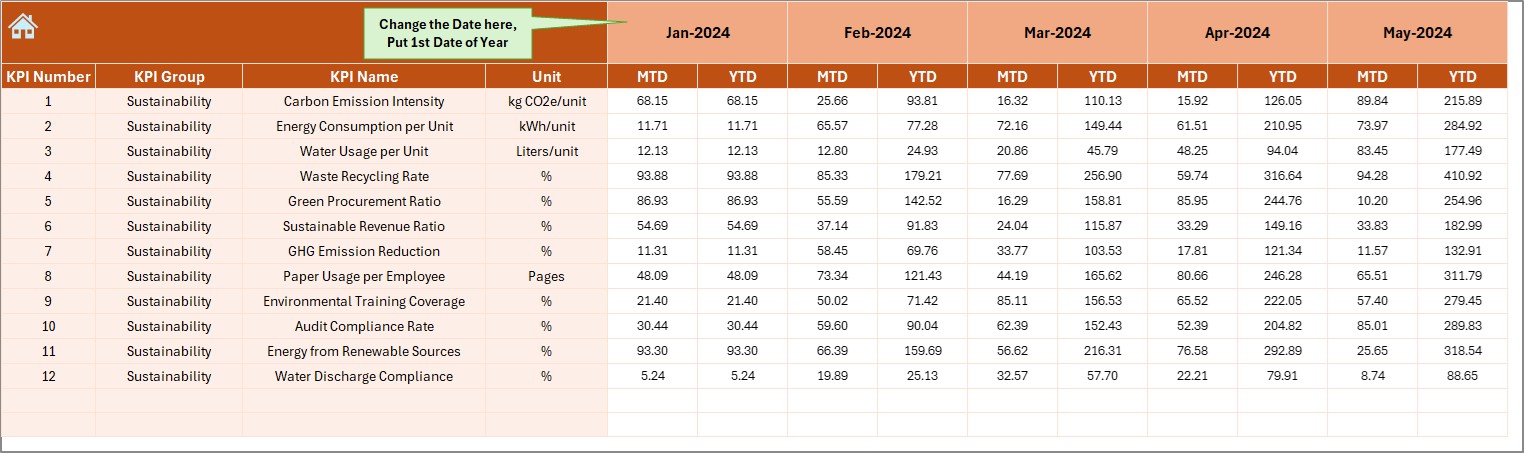
- Enter monthly actual data for each KPI
- Change the year-starting month at Range E1 to automatically align periods
Target Sheet
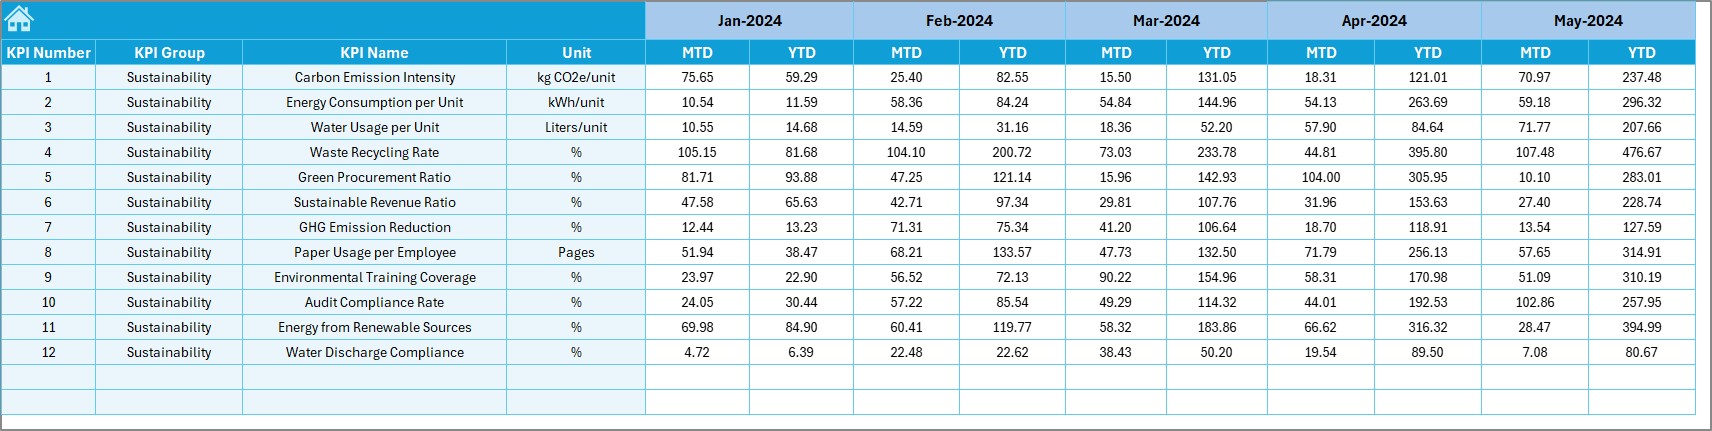
- Enter monthly MTD and YTD targets per KPI
- Supports long-term performance tracking
Previous Year Numbers Sheet
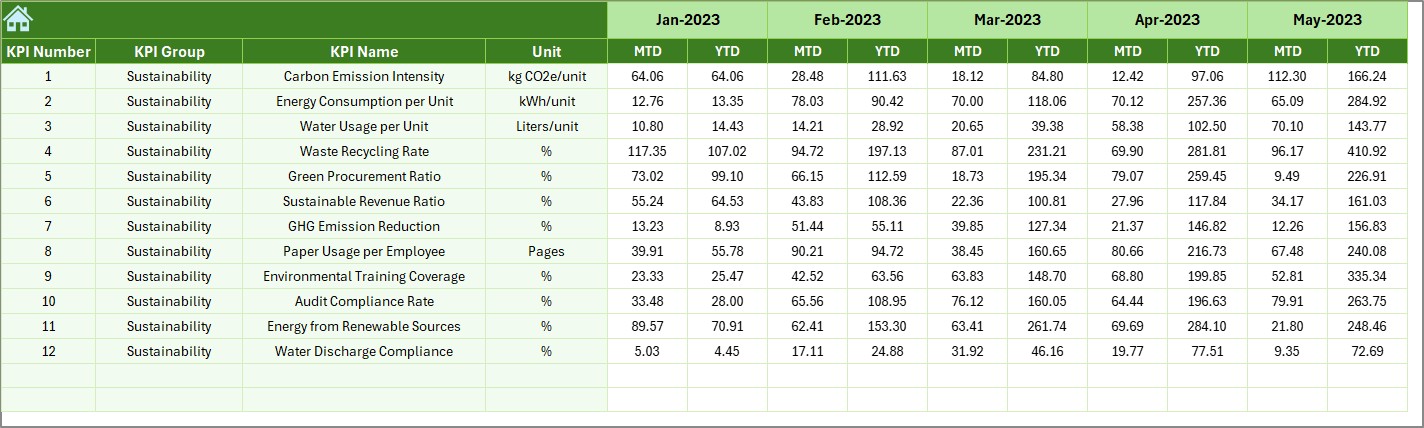
- Archive last year’s figures to compare with current performance
KPI Definition Sheet
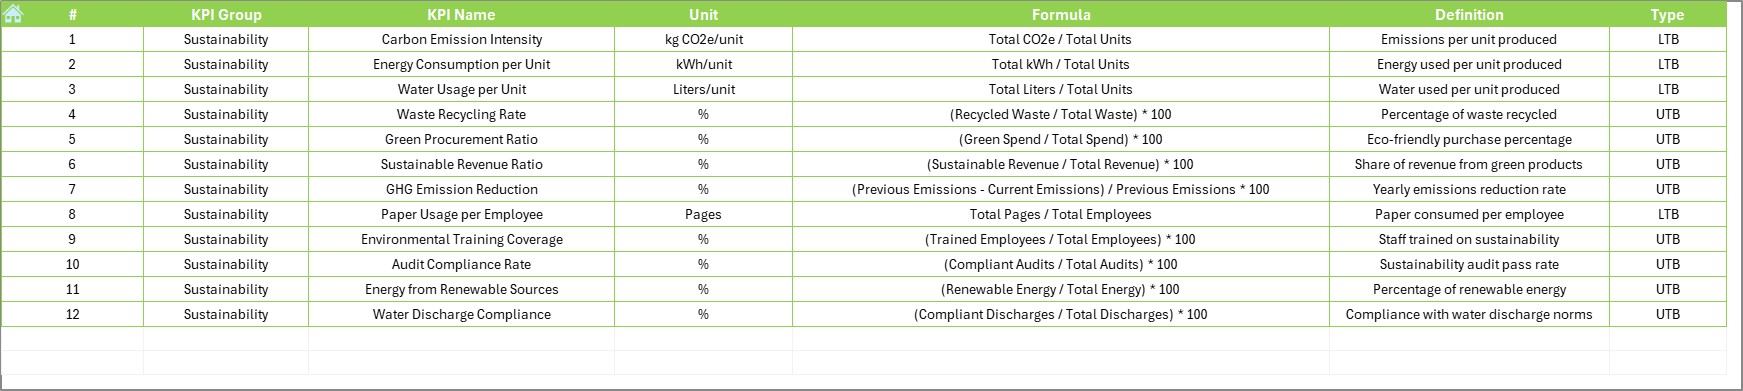
- Maintain master data for KPI attributes: Name, Group, Unit, Formula, and Definition
Advantages of Using a Finance and Accounting Sustainability KPI Dashboard
📊 Enhanced Decision Making
It combines financial and sustainability data, enabling a more holistic view of organizational performance.
⏰ Time-Saving
The structured format and drop-down selectors make analysis quick and straightforward.
💡 Increased Visibility
Conditional formatting and graphical elements highlight performance gaps instantly.
💳 Financial + ESG Tracking
Sustainability reporting is no longer a standalone task but integrated into core finance workflows.
🧰 Customizable for Any Industry
With editable KPI names, units, and formulas, it works across multiple sectors.
Click to Purchases Finance and Accounting Sustainability KPI Dashboard in Excel
Best Practices for Using the KPI Dashboard
Define Clear KPIs
Make sure every KPI has a purpose, a formula, a unit of measurement, and a clear owner.
Update Monthly Without Fail
Timely updates of actuals, targets, and previous year data ensure the dashboard remains reliable.
Automate Where Possible
Use Excel formulas or VBA to reduce manual entry and increase accuracy.
Train Your Team
Ensure all stakeholders know how to read and update the dashboard.
Use Conditional Formatting Wisely
Up/down arrows and color indicators must be consistent and intuitive.
Review Trends Regularly
The KPI Trend sheet is valuable for quarterly reviews and strategy refinement.
❓ Frequently Asked Questions (FAQs)
What kind of KPIs can I track using this dashboard?
You can track financial KPIs like Cost per Unit, Return on Investment, and Operating Margin, as well as sustainability metrics such as Carbon Emissions per Revenue and Energy Consumption Rate.
Is this dashboard compatible with all Excel versions?
Yes, it works with most modern Excel versions, preferably Excel 2016 and above.
Can I add new KPIs to this dashboard?
Absolutely. Just update the KPI Definition sheet and ensure corresponding data is added in input and target sheets.
What does UTB and LTB mean?
UTB (Upper the Better) and LTB (Lower the Better) are performance indicators. For example, revenue is UTB, while cost is LTB.
Do I need Excel expertise to use this?
No advanced skills needed. The dashboard uses simple drop-downs and clear labels.
Conclusion
The Finance and Accounting Sustainability KPI Dashboard in Excel is more than just a spreadsheet. It is a complete toolkit for aligning your company’s financial performance with sustainability goals. Whether you’re a CFO, financial analyst, or sustainability officer, this dashboard simplifies the complexity of ESG tracking and financial reporting. Easy to use, fully customizable, and deeply insightful—this template is an indispensable asset for any modern finance team.
Click to Purchases Finance and Accounting Sustainability KPI Dashboard in Excel
Visit our YouTube channel to learn step-by-step video tutorials