In today’s data-driven world, businesses need to keep a close eye on their financial performance to stay competitive. A Finance KPI Dashboard is a powerful tool designed to help businesses monitor key financial indicators, make data-backed decisions, and optimize operations effectively. In this article, we’ll explore the components of a Finance KPI Dashboard, its advantages, best practices for implementation, areas for improvement, and frequently asked questions.
Let’s dive into what makes this dashboard essential for organizations and how to get the most out of it.
What is a Finance KPI Dashboard?
A Finance KPI Dashboard is a comprehensive reporting tool that consolidates essential financial metrics into a single visual interface. It offers real-time insights into a company’s performance through Key Performance Indicators (KPIs) such as revenue, profitability, and expenses. This dashboard not only tracks actual performance against targets but also displays trends and comparisons with historical data.
By providing a snapshot of the company’s financial health, the Finance KPI Dashboard ensures that key stakeholders can identify areas for improvement and make timely adjustments.
Key Features of the Finance KPI Dashboard
The Finance KPI Dashboard template offers seven key worksheets that work seamlessly together to track, manage, and display financial performance data:
Home Sheet
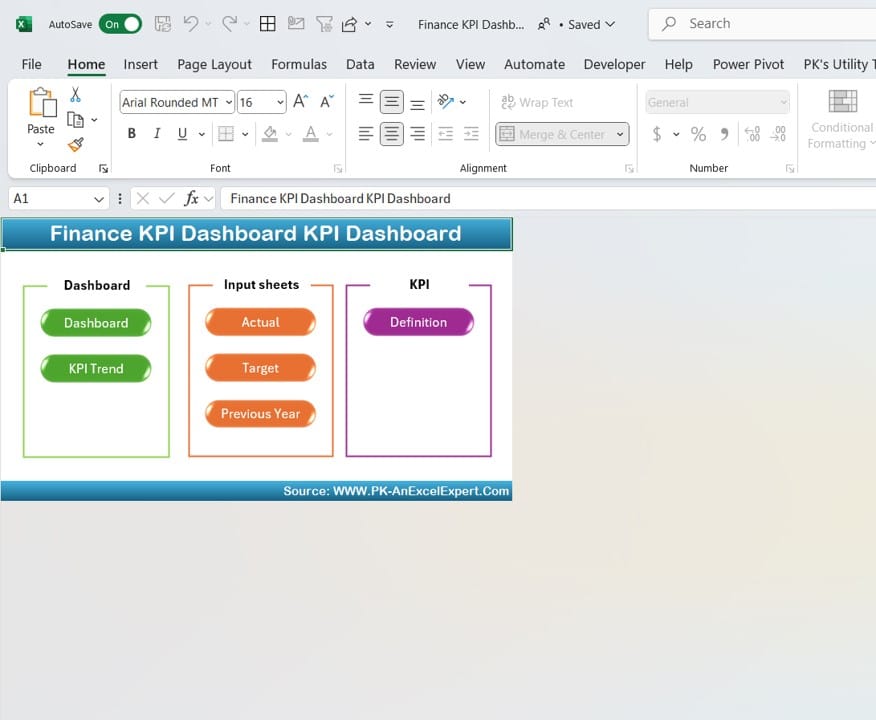
The Home Sheet serves as the navigation panel. It features six buttons that help users jump quickly to the respective sheets, ensuring easy access to relevant information. This intuitive design makes the dashboard user-friendly and minimizes the time needed to locate key metrics.
Dashboard Sheet Tab

Dashboard Sheet Tab
Dashboard Sheet Tab This is the main tab where the core KPIs are presented.
- Users can select a month from the drop-down list (cell D3) to see monthly data updates.
- Metrics displayed include:
- MTD (Month-to-Date) Actual
- MTD Target
- MTD Previous Year Data
- Comparison of Target vs. Actual with conditional arrows showing progress.
- YTD (Year-to-Date) Actual, Target, and Previous Year data for a comprehensive view.
- Conditional formatting with up and down arrows provides a visual representation of whether the KPIs are meeting targets.
KPI Trend Sheet Tab

KPI Trend Sheet Tab KPI Trend
This tab offers deeper insights into KPI trends. Users can:
- Select a KPI from the drop-down menu (range C3) to analyze trends over time.
- View detailed information, including:
- KPI Group
- Unit of Measurement
- Type of KPI: “Lower the Better” or “Upper the Better”
- Formula and KPI Definition
- Visualize trends through MTD and YTD charts comparing actual, target, and previous year data.
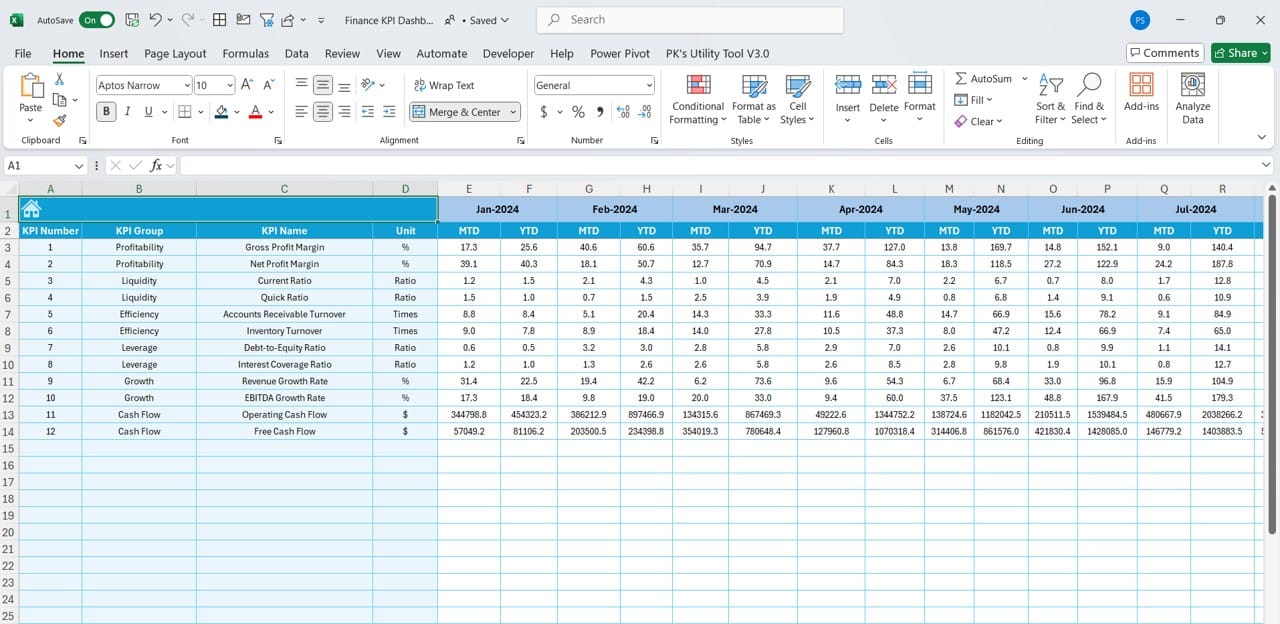
Actual Numbers Input Sheet

Actual Numbers Input Sheet
- This is where the actual performance data is entered for both MTD and YTD periods.
- Users need to input the first month of the financial year in range E1, and all other month-based calculations will follow.
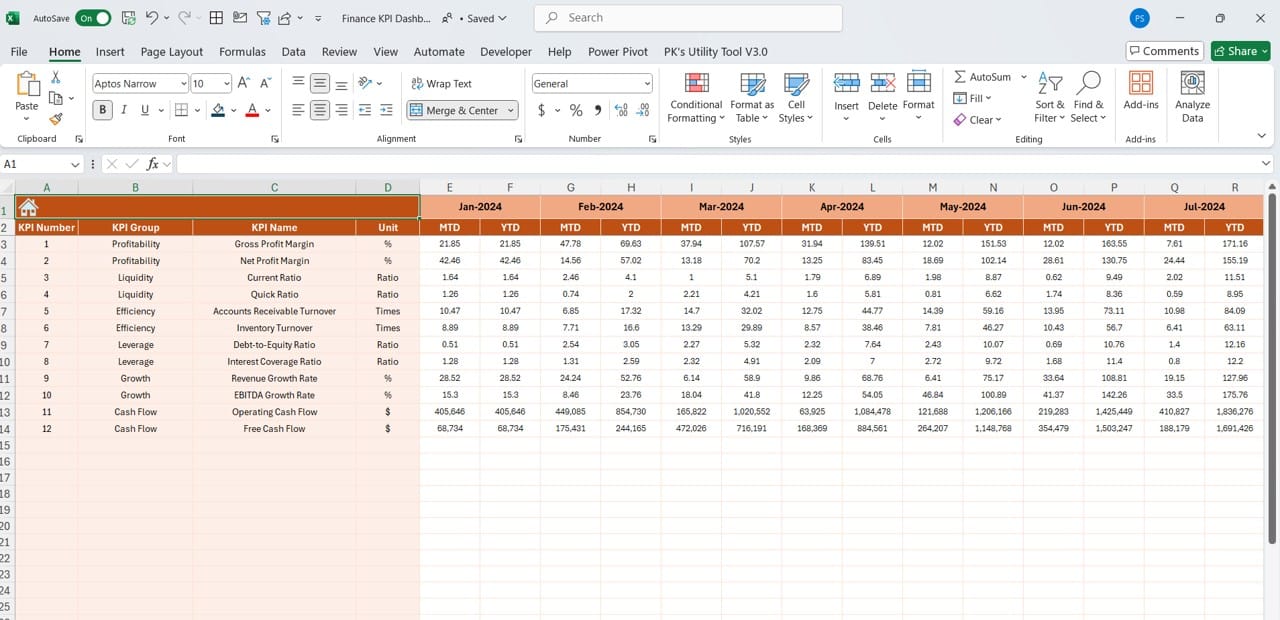
Target Sheet Tab
Target Sheet Tab
- This tab allows users to set targets for each KPI, both on a monthly (MTD) and year-to-date (YTD) basis. Having clear targets ensures accurate performance measurement.
Previous Year Numbers Sheet Tab
Previous Year Numbers Sheet Tab Here, users must enter the previous year’s performance numbers. This helps compare past and current performance to identify trends and growth opportunities.
KPI Definition Sheet Tab
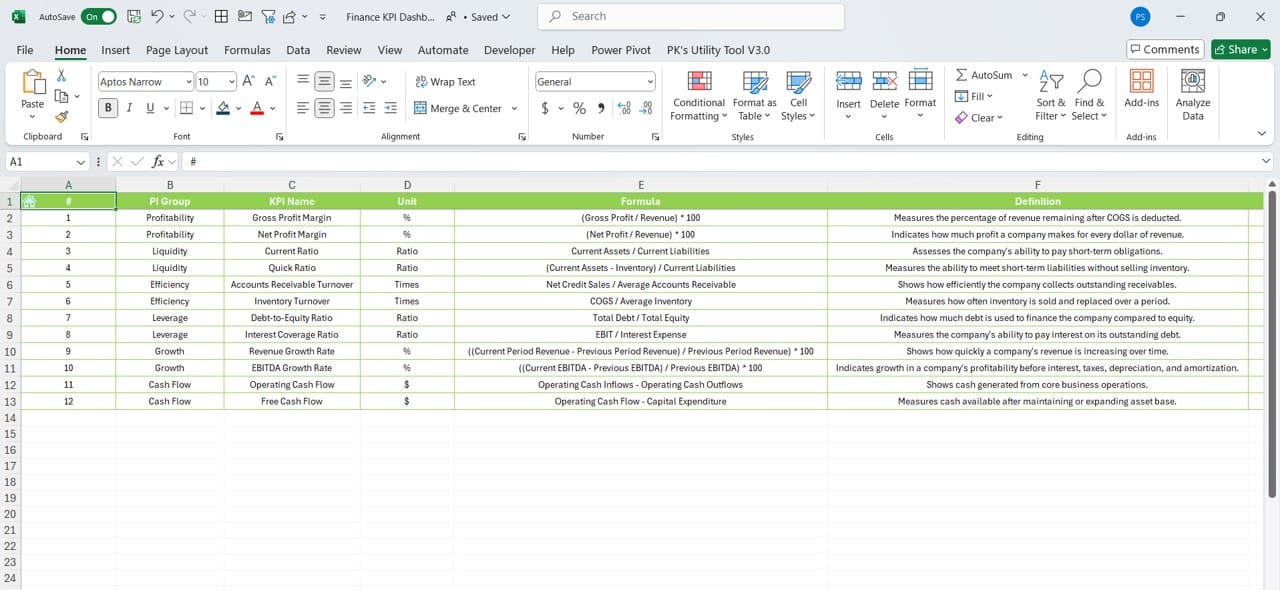
This is where KPI details are documented. Users can define the:
- KPI Name
- KPI Group
- Measurement Unit
- Formula for calculation
- Brief KPI Definition
Advantages of Using a Finance KPI Dashboard
- Improved Decision-Making: With real-time visibility into financial metrics, managers can identify performance gaps and make timely decisions.
- Easy Comparison of Targets and Actuals: The conditional formatting with arrows makes it easy to spot areas where performance lags targets.
- Comprehensive Tracking
The dashboard tracks MTD and YTD performance along with previous year comparisons, ensuring a complete view of financial health.
- User-Friendly Navigation: The Home Sheet’s button-based navigation simplifies the user experience, reducing the time needed to access critical information.
Opportunities for Improvement in Finance KPI Dashboards
- Automating Data Input: Integrating the dashboard with financial systems can eliminate manual data entry, improving accuracy and saving time.
- Advanced Visualizations: Adding more visual elements, such as interactive charts or graphs, can enhance data storytelling.
- Integration with Power BI or Google Sheets: Incorporating additional tools for dynamic reporting can make the dashboard even more powerful and flexible.
- Custom Alerts for KPI Deviations: Setting up email or dashboard alerts for KPI deviations can help stakeholders address issues proactively.
Best Practices for Creating an Effective Finance KPI Dashboard
- Select Relevant KPIs: Choose KPIs that align with your organization’s financial objectives to avoid cluttering the dashboard with unnecessary metrics.
- Ensure Data Accuracy: Regularly audit your data to maintain accuracy and reliability. Incorrect data can lead to poor decision-making.
- Use Clear Visuals: Leverage conditional formatting, color codes, and easy-to-read charts to convey information at a glance.
- Update Regularly: Ensure that the dashboard is updated frequently to reflect real-time performance and provide timely insights.
- Involve Stakeholders: Collaborate with department heads to define KPIs that matter most to their teams and align with business goals.
How to Set Up the Finance KPI Dashboard
Here’s a quick step-by-step guide to setting up the Finance KPI Dashboard:
- Enter Actual Numbers in the “Actual Numbers Input” tab for both MTD and YTD.
- Set Target Values in the “Target” sheet for each KPI.
- Input Previous Year Data to enable comparisons with historical performance.
- Use the Dashboard tab to view the updated KPIs and identify performance trends.
- Utilize the Trend tab to analyses specific KPI trends over time and determine if performance goals are being met.
Conclusion
The Finance KPI Dashboard is a vital tool for organizations to track financial health, measure progress, and make informed decisions. By consolidating multiple financial metrics into one visual interface, this dashboard simplifies performance monitoring and helps businesses stay on track with their goals. Whether you need to monitor month-to-date trends or compare performance with previous years, this dashboard offers an efficient way to keep your financial KPIs in check.
Frequently Asked Questions (FAQs)
What is the purpose of a Finance KPI Dashboard?
The purpose of a Finance KPI Dashboard is to consolidate key financial metrics into one interface, allowing managers to monitor performance, make decisions, and identify areas for improvement.
How often should the Finance KPI Dashboard be updated?
It is recommended to update the dashboard at least monthly. However, real-time updates can provide more timely insights.
Can the Finance KPI Dashboard be customized?
Yes, the dashboard is highly customizable. Users can modify KPIs, add more metrics, or change target values to suit their business needs.
What are the essential KPIs to include in a Finance KPI Dashboard?
Some key KPIs include Revenue Growth, Profit Margin, Operating Expenses, Cash Flow, and Debt-to-Equity Ratio.
How can we improve the accuracy of data in the Finance KPI Dashboard?
To ensure data accuracy, integrate the dashboard with ERP or accounting software and conduct regular data audits.
This article provides a comprehensive overview of a Finance KPI Dashboard, covering its features, advantages, opportunities for improvement, and best practices. With a clear understanding of how to set up and utilize this dashboard, businesses can confidently monitor their financial performance and drive sustainable growth.
Visit our YouTube channel to learn step-by-step video tutorials