Managing financial risks is crucial for any business. Tracking key performance indicators (KPIs) helps organizations stay on top of potential risks and make informed decisions. The Financial Risk KPI Dashboard in Excel is a powerful tool that provides real-time insights into financial health, ensuring businesses adhere to budgets and minimize risks.
In this article, we will cover everything you need to know about the Financial Risk KPI Dashboard in Excel—its structure, advantages, best practices, and how to use it efficiently.
Click to Financial Risk KPI
What is a Financial Risk KPI Dashboard?
A Financial Risk KPI Dashboard is an Excel-based tool designed to help businesses monitor and manage financial risks. It provides a centralized view of financial metrics, such as budget adherence, variance analysis, and financial trends, allowing decision-makers to take proactive measures.
This dashboard consists of seven structured worksheets, each serving a specific purpose, from data entry to visualization.
Key Features of the Financial Risk KPI Dashboard
Home Sheet
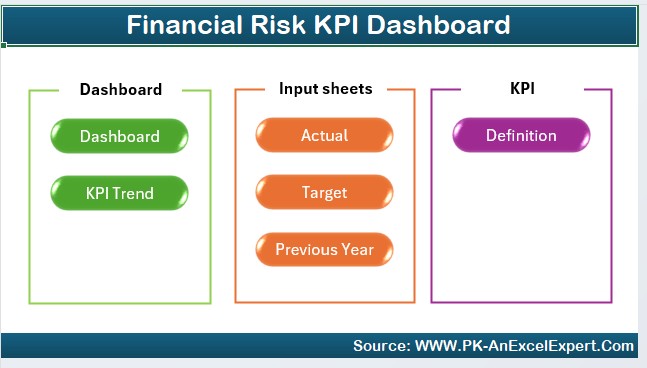
- Acts as an index page for easy navigation.
- Contains six buttons that link to different sheets within the dashboard.
Dashboard Sheet Tab
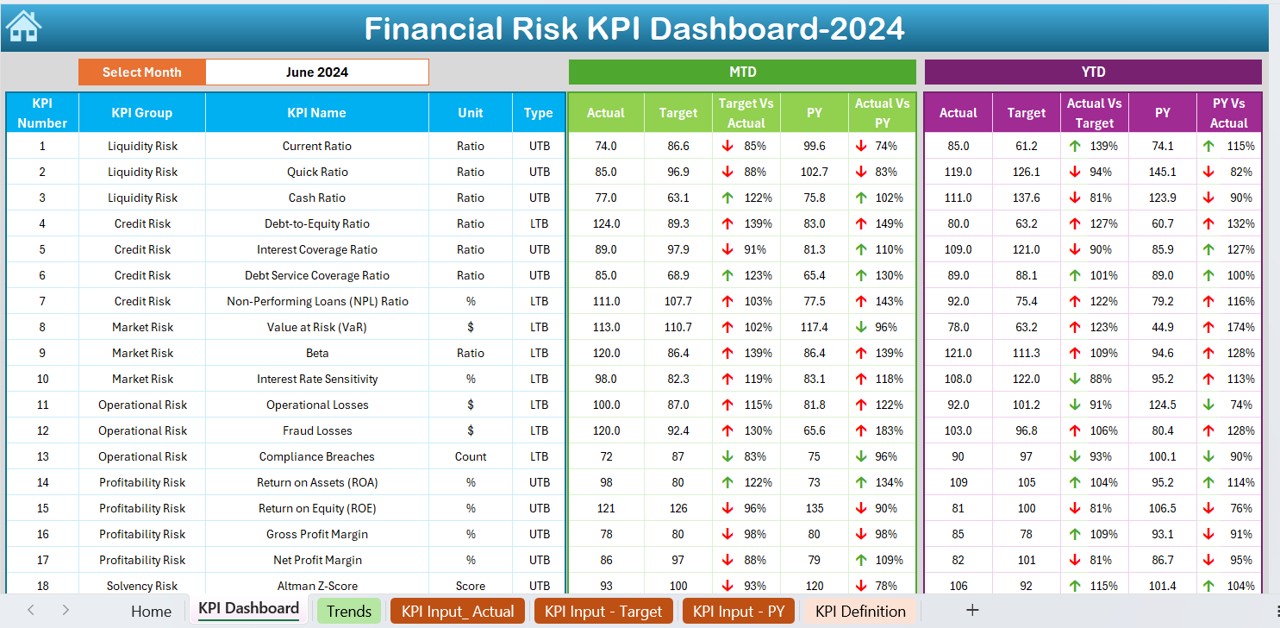
- The core visualization sheet displaying all KPIs.
- Users can select a month from the drop-down in D3, dynamically updating the dashboard.
- Displays MTD (Month-to-Date) and YTD (Year-to-Date) Actual, Target, and Previous Year data.
- Includes Conditional Formatting with up/down arrows to highlight trends.
KPI Trend Sheet
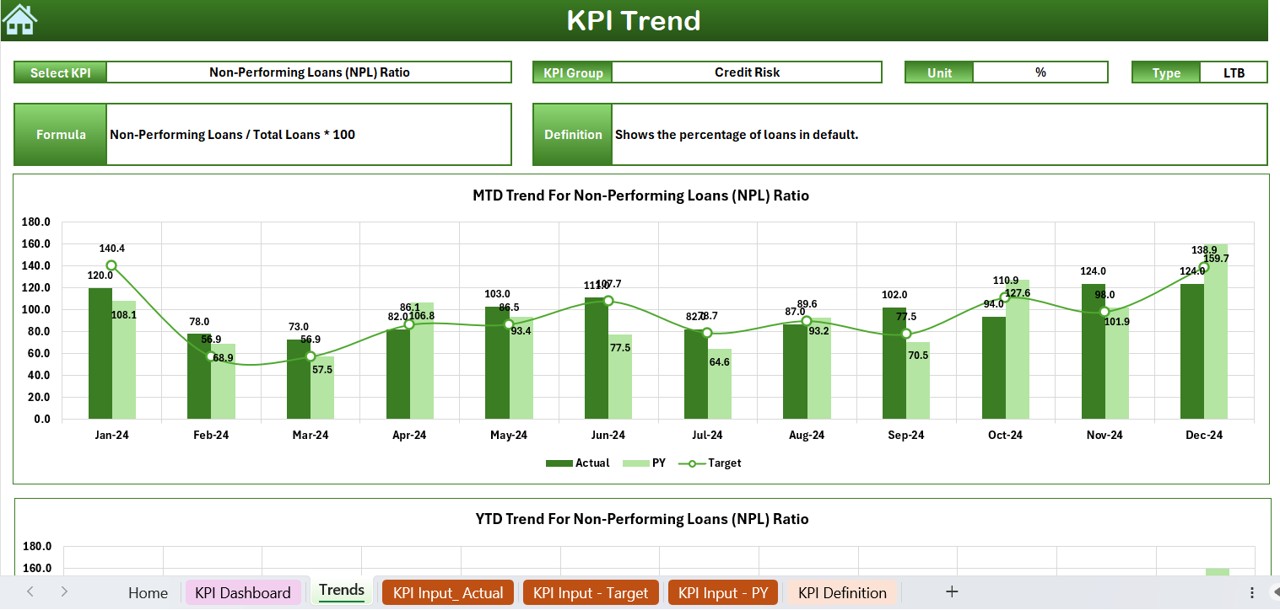
Allows users to select a KPI from a drop-down in C3.
Displays:
- KPI Group
- Unit of KPI
- KPI Type (Lower the Better / Upper the Better)
- Formula & Definition
- Includes trend charts for MTD and YTD comparisons.
Actual Numbers Input Sheet
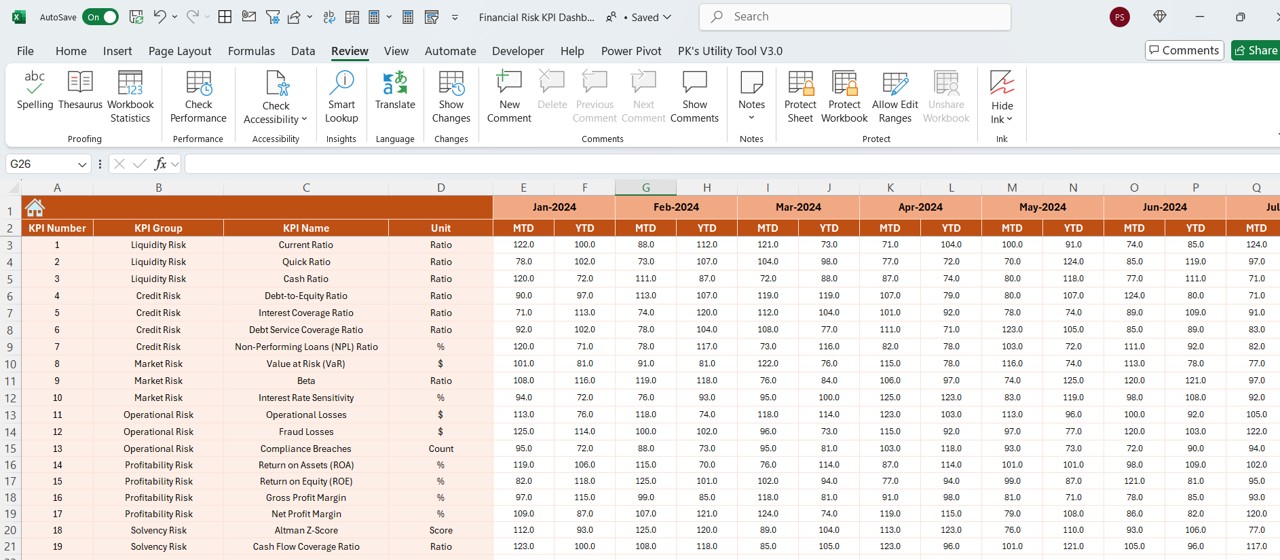
- Data entry sheet for MTD and YTD actual values.
- Users can modify months by entering the starting month in E1.
Click to Financial Risk KPI
Target Sheet
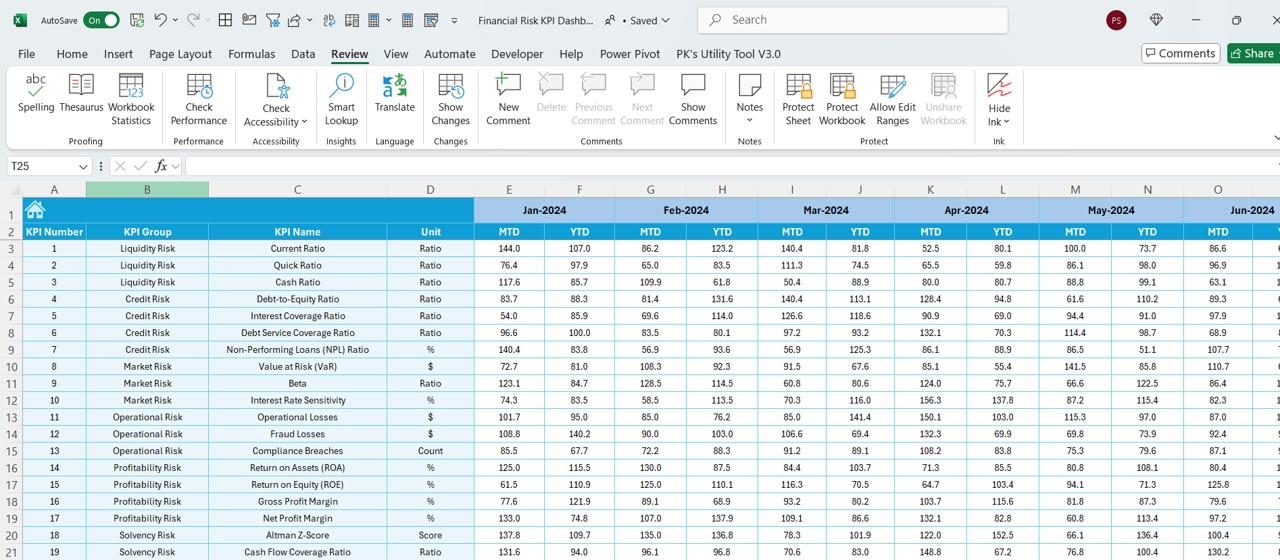
- Used to input target values for each KPI on a monthly basis.
- Supports both MTD and YTD targets.
Previous Year Numbers Sheet
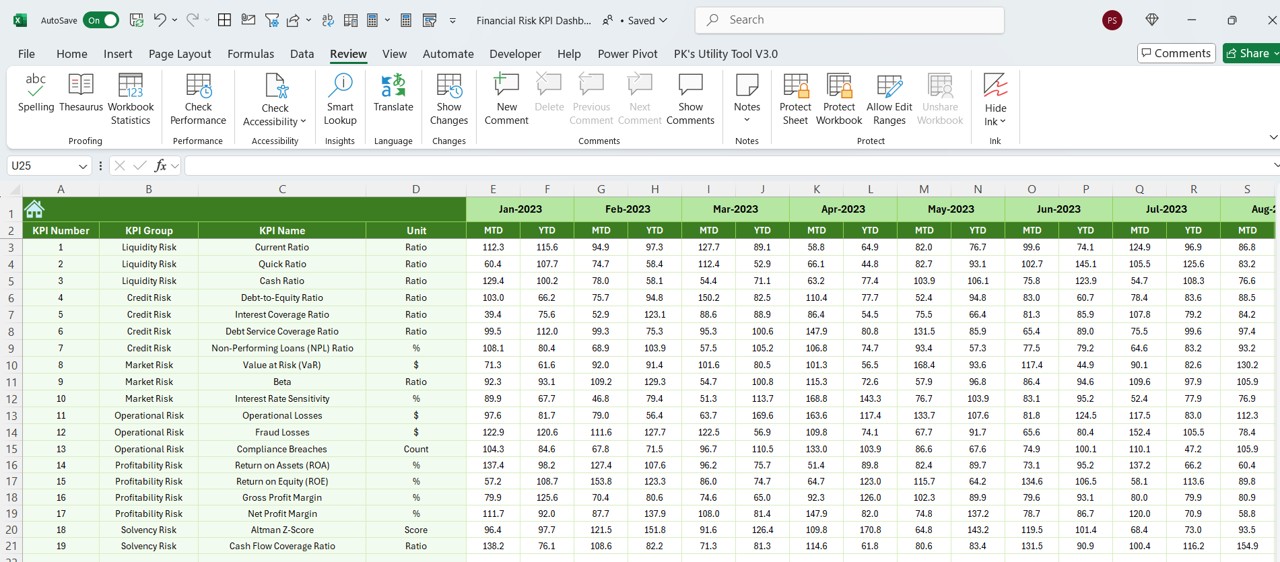
- Stores previous year’s financial data for comparison with current numbers.
KPI Definition Sheet
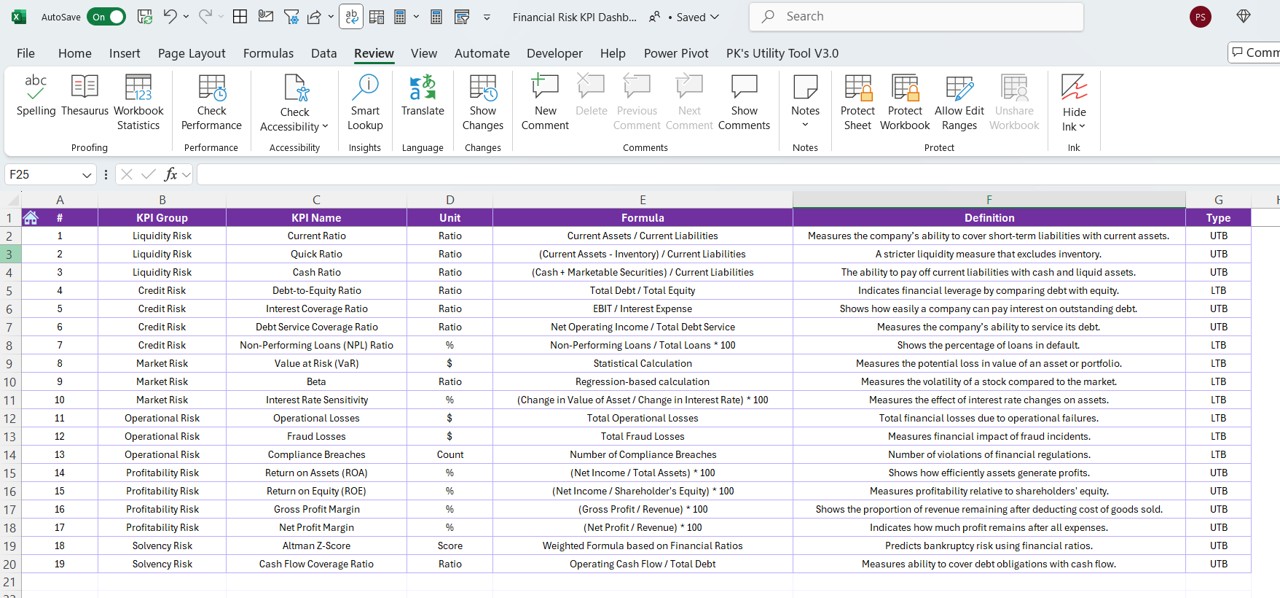
Users can define KPIs with details such as:
- KPI Name
- KPI Group
- Unit
- Formula
- Definition
Advantages of Using a Financial Risk KPI Dashboard
- Real-time Financial Monitoring: Stay updated on financial performance with dynamic visualizations.
- Data-driven Decision Making: Helps businesses identify trends and make informed financial decisions.
- Quick Performance Comparison: Compare current financial metrics with targets and previous year’s data.
- Customizable & Scalable: Adaptable to business needs, allowing users to define and modify KPIs.
- Enhanced Financial Transparency: Provides a clear picture of financial health, helping stakeholders assess risks.
Click to Financial Risk KPI
Best Practices for Using the Financial Risk KPI Dashboard
Keep Data Updated
Regularly input actual and target values to maintain accurate analysis.
Utilize Trend Analysis
Use the KPI Trend Sheet to track monthly and yearly performance trends.
Monitor Key KPIs Closely
Focus on KPIs that have the greatest financial impact on your business.
Leverage Conditional Formatting
Highlight risks using color-coded indicators to spot budget deviations quickly.
Validate KPI Formulas
Ensure that KPI formulas are correctly applied in the KPI Definition Sheet.
Use Historical Data for Forecasting
Compare current performance with previous years to predict future trends.
How to Use the Financial Risk KPI Dashboard Step-by-Step
Step 1: Set Up the Dashboard
- Open the Financial Risk KPI Dashboard in Excel.
- Navigate to the Home Sheet and use the buttons to explore different tabs.
Step 2: Enter Actual Financial Data
- Go to the Actual Numbers Input Sheet.
- Enter MTD and YTD actual values for the relevant month.
- Ensure the first month of the year is correctly set in E1.
Step 3: Define KPI Targets
- Move to the Target Sheet.
- Input monthly and yearly targets for each KPI.
Step 4: Compare with Previous Year’s Data
- Enter last year’s MTD and YTD values in the Previous Year Numbers Sheet.
Step 5: Visualize Performance
- Visit the Dashboard Sheet.
- Select the Month (D3) and analyze the MTD and YTD trends.
- Use the up/down conditional formatting arrows to identify areas needing improvement.
Step 6: Analyze KPI Trends
- On the KPI Trend Sheet, choose a KPI from the drop-down list.
- Review performance trends through the KPI trend charts.
Step 7: Adjust Strategy Accordingly
- If performance is below targets, reassess budget allocation and risk mitigation strategies.
- Adjust financial goals based on trend analysis.
Conclusion
The Financial Risk KPI Dashboard in Excel is a powerful tool that helps businesses monitor financial health, track performance, and reduce financial risks. By leveraging real-time data, businesses can make informed decisions and stay on track with their financial goals.
Implementing this dashboard effectively will enhance financial transparency, decision-making, and long-term business success.
Click to Financial Risk KPI
Frequently Asked Questions (FAQs)
What is a Financial Risk KPI?
A Financial Risk KPI is a measurable metric that helps businesses assess financial risks, track performance, and ensure budget adherence.
How does this KPI Dashboard help in financial management?
The Financial Risk KPI Dashboard helps businesses track key financial metrics, compare performance trends, and make data-driven decisions to mitigate risks.
Can I customize the KPIs in the dashboard?
Yes, you can modify the KPI Definition Sheet to define new KPIs based on your business needs.
How often should I update the dashboard?
For optimal performance, update the dashboard monthly or weekly, depending on your business requirements.
What if my actual numbers differ significantly from targets?
If actuals deviate from targets, analyze trends in the KPI Trend Sheet, identify problem areas, and adjust financial strategies accordingly.
Can this dashboard be used for forecasting?
Yes, by comparing historical data with current trends, businesses can forecast future financial performance and take proactive measures.
Is this dashboard suitable for small businesses?
Absolutely! The Financial Risk KPI Dashboard in Excel is customizable, making it suitable for businesses of all sizes.
Final Thoughts
Whether you’re a finance professional, business owner, or analyst, this Financial Risk KPI Dashboard simplifies financial tracking and risk management. Implement it today to enhance financial decision-making and drive business success!
Click to Financial Risk KPI
Visit our YouTube channel to learn step-by-step video tutorials
View this post on Instagram