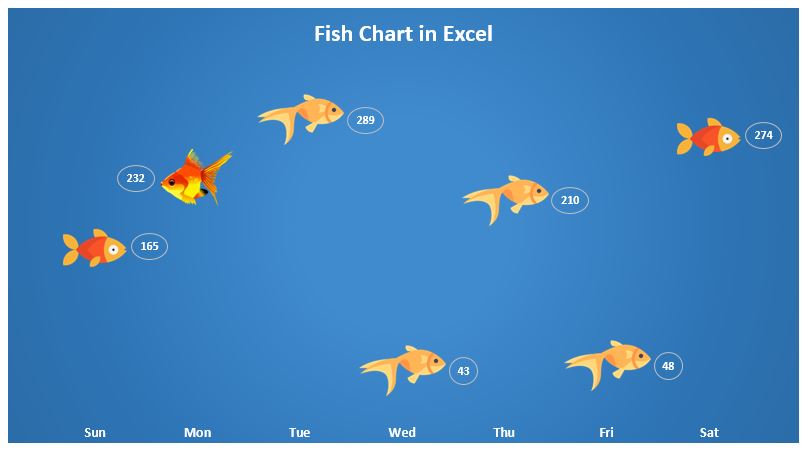
Fish Chart is my lasted innovation. I have used it to display sales data points. The new thing is that fishes are getting changed randomly whenever worksheet is recalculated. I have used 3 fishes here. Data label is in front of fish’s mouth looking as a water bubble. I have used Line Chart to create this.
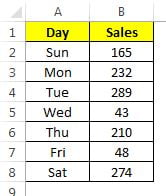
Below is the data set for fish chart.
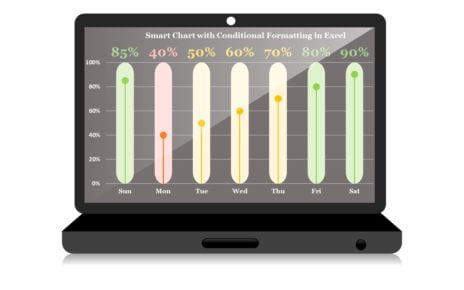
Fish Chart in Excel
Click to buy Fish Chart in Excel
Visit our YouTube channel to learn step-by-step video tutorials
Watch the step by step video tutorial:
Click to buy Fish Chart in Excel