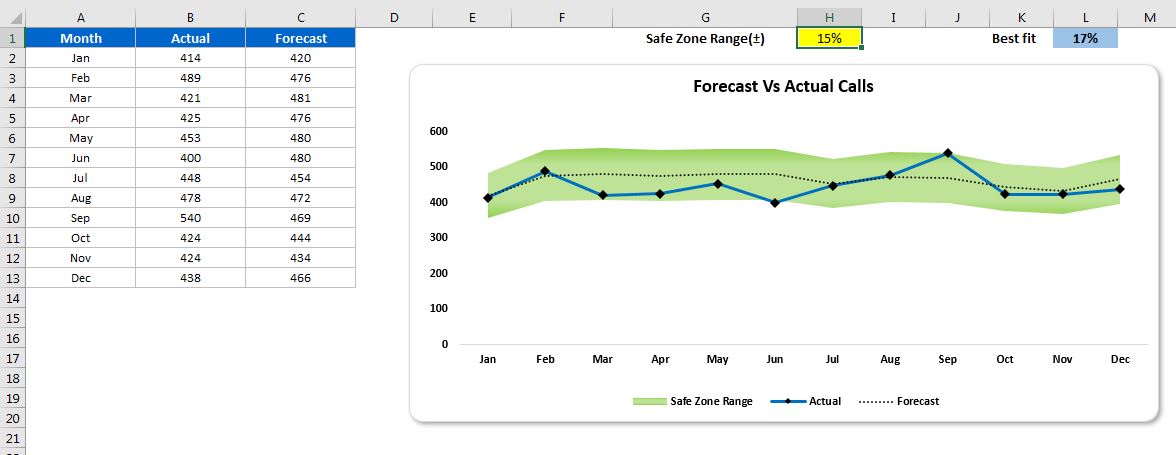
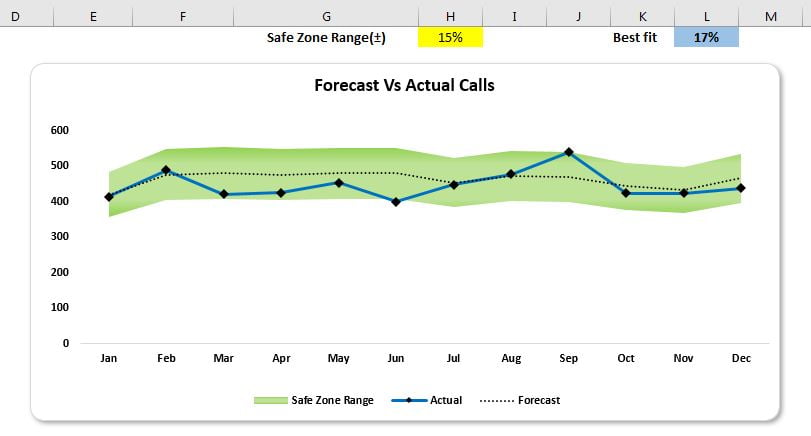
In this article, we have created a Forecast Vs Actual Chart with Safe Zone Range. This is a very informative chart wherein you can display that your actual numbers are within the forecast range or not.
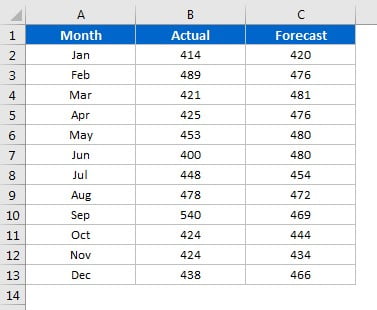
We have below given data to create this chart-
We have created a below given chart where we have displayed – Forecast, Actual and Safe Zone Range. Safe Zone range is dynamic. It will adjust on the chart automatically. Safe Zone Range is ± given % of the yellow highlighted cell. For example – if we put 10% in yellow highlighted cell and our forecast for a month is 100 then Safe Zone Range will be 90 to 110 for that month.
Click to buy Forecast Vs Actual Chart with Safe Zone Range in Excel
Watch the step by step video tutorial:
Visit our YouTube channel to learn step-by-step video tutorials