Managing a fundraising campaign effectively requires tracking key performance indicators (KPIs) to measure progress, analyze trends, and ensure that financial and engagement goals are met. A Fundraising Campaign KPI Dashboard in Excel provides a structured, easy-to-use solution to monitor crucial fundraising metrics in real time. This article will walk you through the features, advantages, and best practices of using this dashboard while helping you understand how to optimize it for maximum efficiency Fundraising Campaign KPI Dashboard.
Click to Fundraising Campaign KPI
Why Use a Fundraising Campaign KPI Dashboard in Excel?
Fundraising involves multiple elements, such as donor contributions, event performance, and campaign effectiveness. Keeping track of all these aspects manually can be overwhelming. A well-designed KPI dashboard simplifies this process by offering:
- Real-time Data Tracking: Monitor campaign performance with live data.
- Goal Comparison: Evaluate actual results against set targets.
- Customizable Insights: Modify key parameters based on campaign needs.
- Trend Analysis: Identify patterns and make data-driven decisions.
- Efficiency and Accuracy: Reduce manual errors and improve reporting.
Key Features of the Fundraising Campaign KPI Dashboard
This Excel dashboard consists of seven worksheets, each serving a specific purpose to ensure effective campaign tracking.
Home Sheet
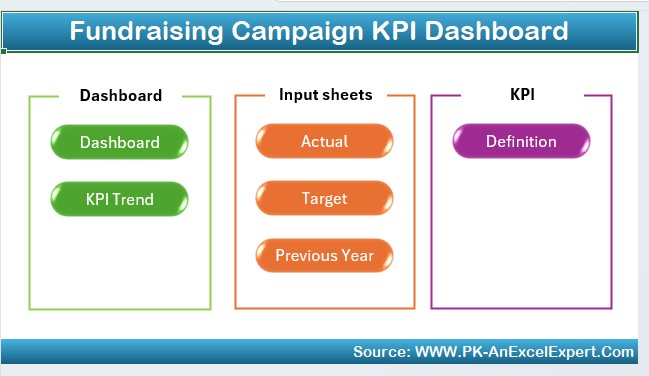
- Acts as the index page with six buttons for easy navigation to different sheets.
- Provides quick access to the most critical sections of the dashboard.
Click to Fundraising Campaign KPI
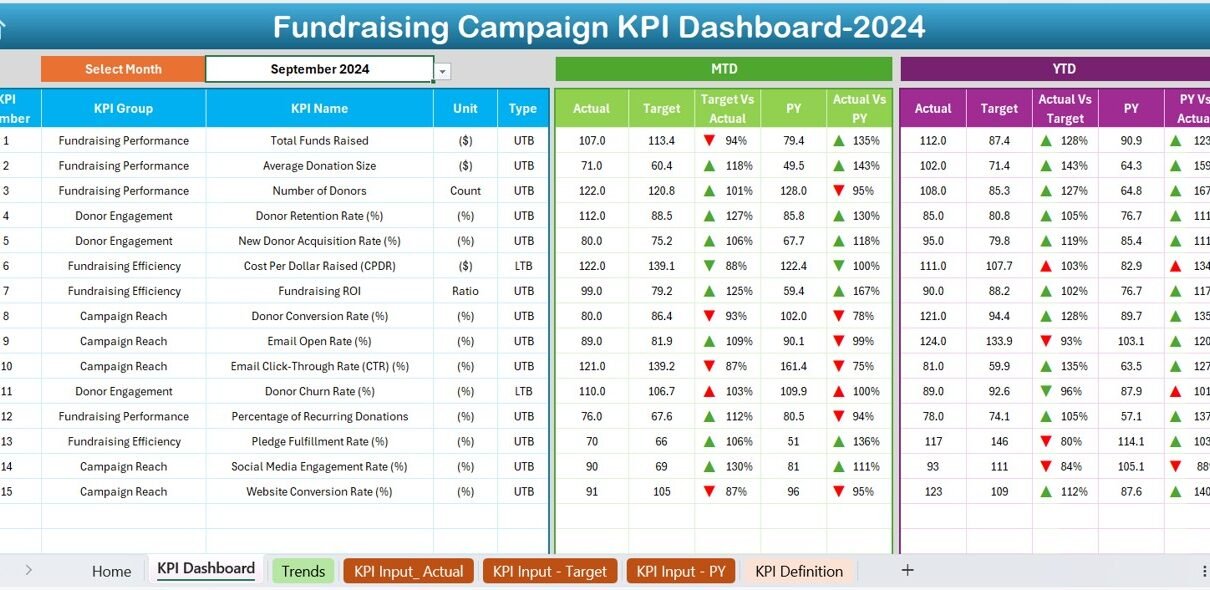
Dashboard Sheet Tab
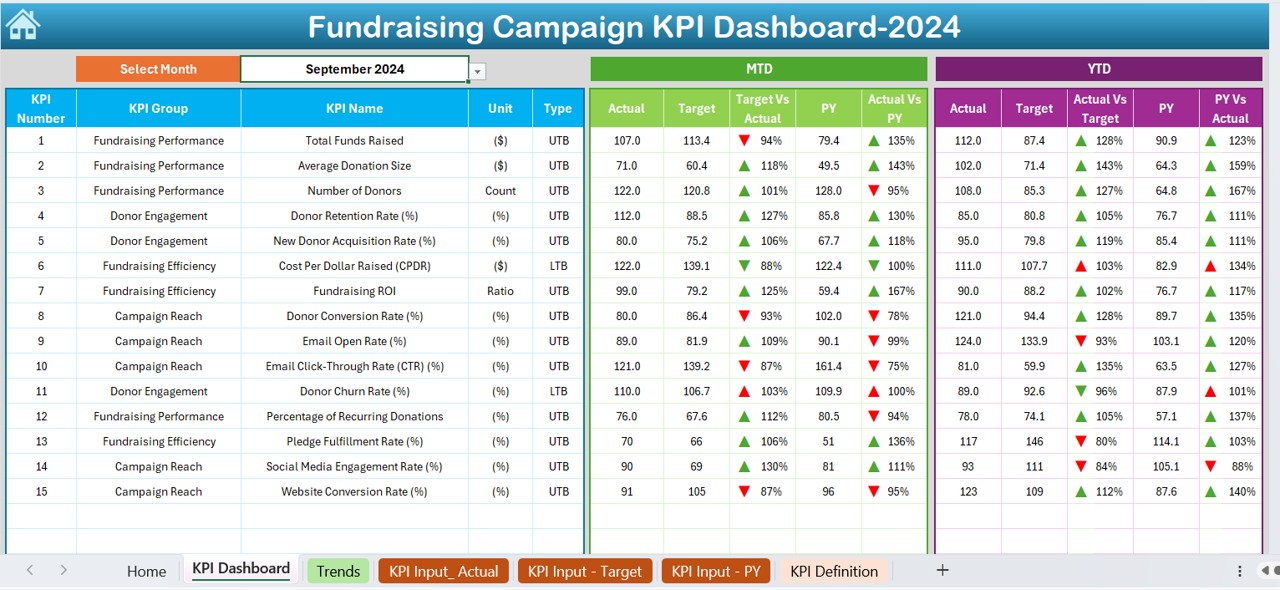
- The main control center where all KPIs are displayed.
- Users can select the month from a dropdown in cell D3, which updates all dashboard numbers accordingly.
Displays:
- MTD (Month-to-Date) and YTD (Year-to-Date) Actual, Target, and Previous Year data.
- Target vs. Actual and Previous Year vs. Actual comparisons.
- Conditional formatting with up/down arrows to highlight trends.
KPI Trend Sheet Tab
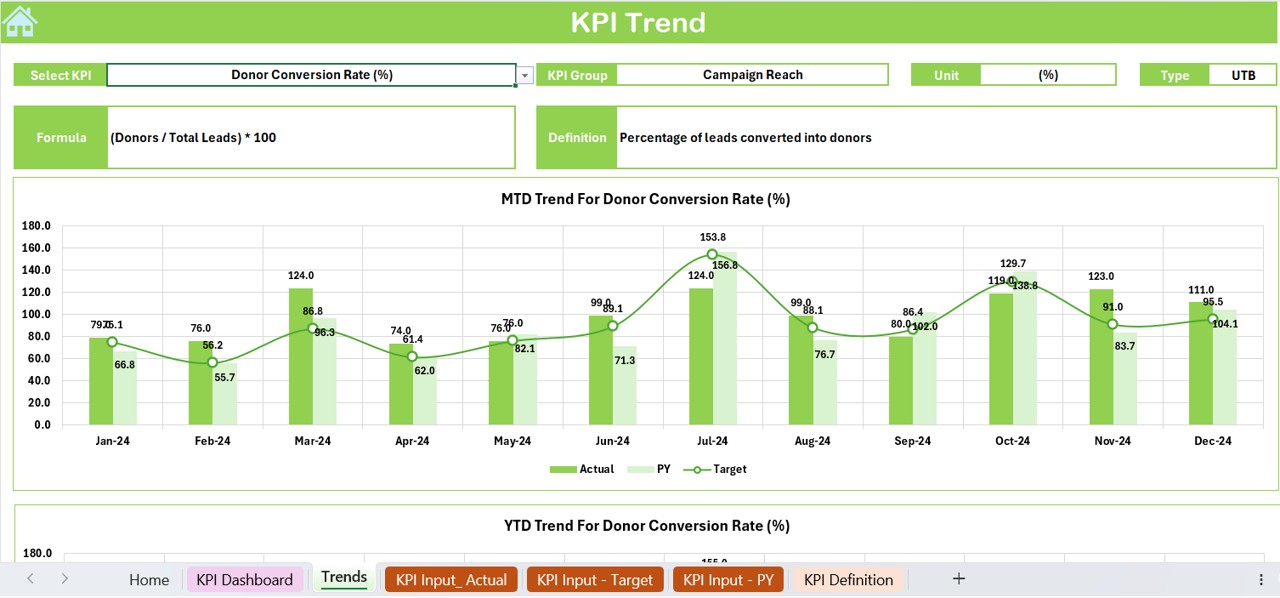
- Allows users to select a KPI name from the dropdown in cell C3.
Displays:
- KPI Group, Unit of KPI, Type (Lower/Upper is Better), Formula, and Definition.
- MTD and YTD trend charts for Actual, Target, and Previous Year values.
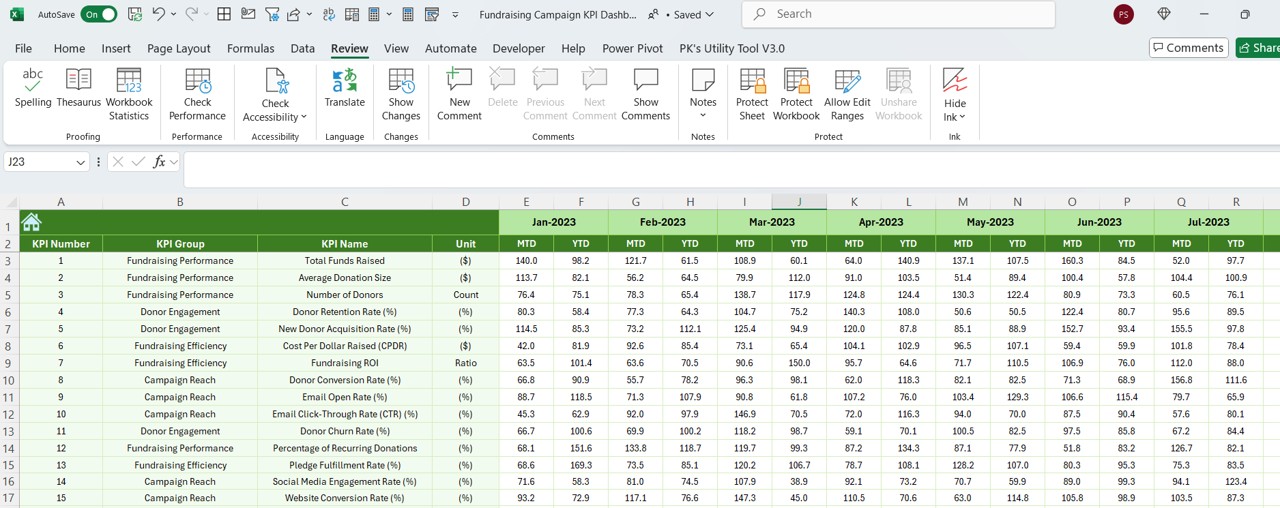
Actual Numbers Input Sheet
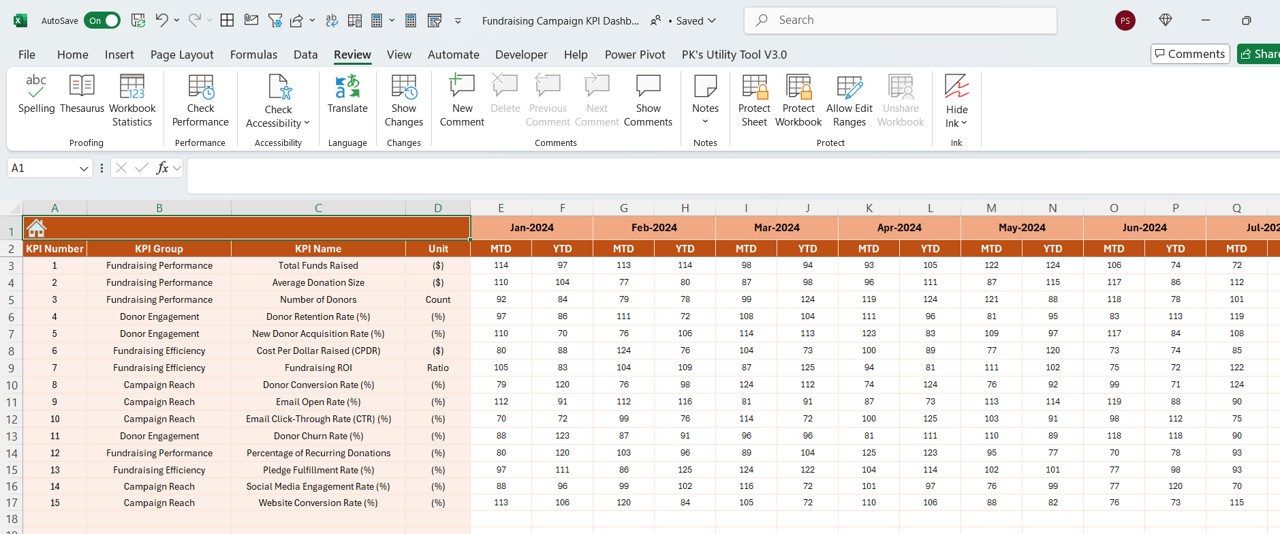
- Users enter actual fundraising data for both MTD and YTD.
- Month selection available in cell E1 – enter the first month of the year to update data dynamically.
Click to Fundraising Campaign KPI
Target Sheet Tab
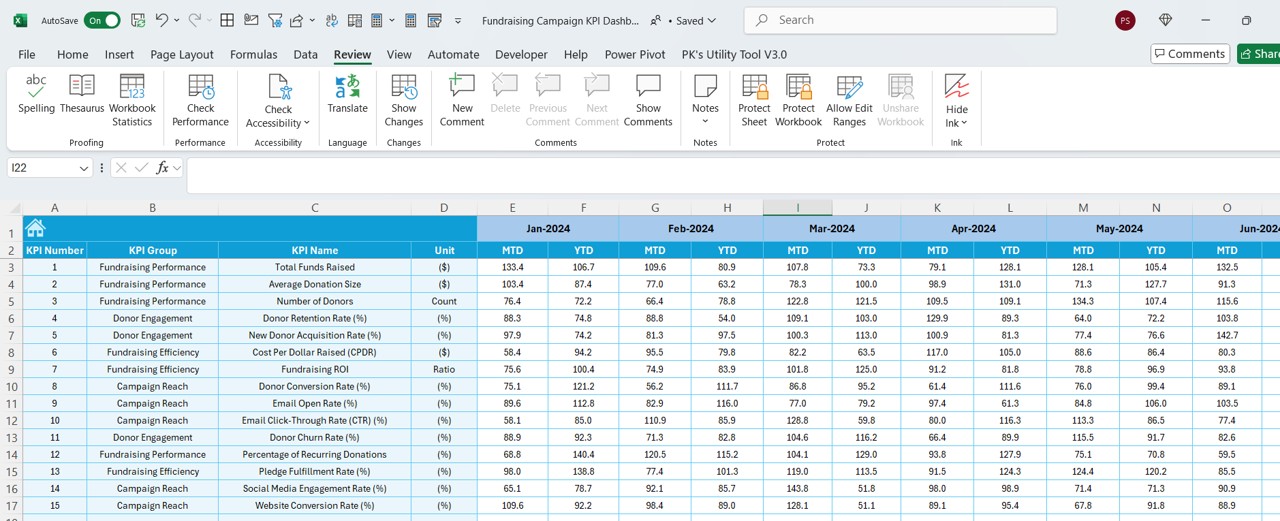
- Users input the monthly and yearly target numbers for each KPI.
Previous Year Numbers Sheet Tab
- Users enter the corresponding previous year’s data for accurate performance comparison.
KPI Definition Sheet Tab
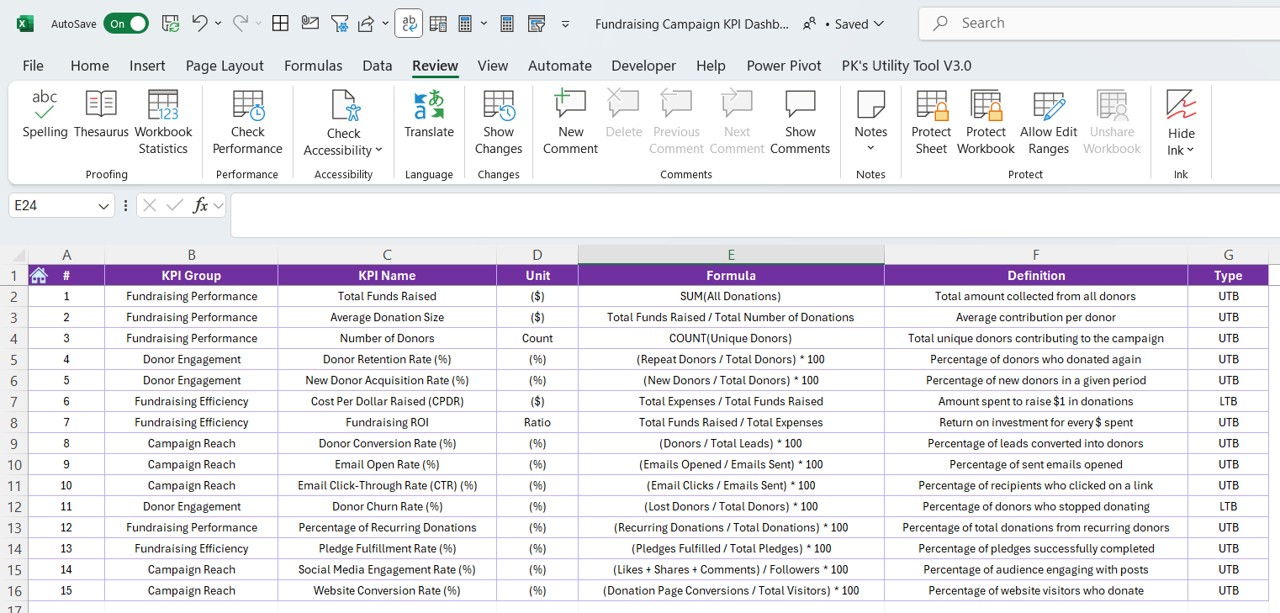
A repository for defining each KPI, including:
- KPI Name
- KPI Group
- Unit of Measurement
- Formula
- KPI Definition
Advantages of Using a Fundraising KPI Dashboard
Real-Time Performance Tracking
Monitor fundraising performance instantly and take immediate action when needed.
Data-Driven Decision Making
Identify trends and make informed strategic decisions based on actual vs. target comparisons.
Improved Accuracy and Efficiency
Automated calculations reduce errors and enhance reporting efficiency.
Better Planning and Forecasting
Historical data trends allow you to set realistic future goals for your campaigns.
Enhanced Donor Engagement
Understand donor behavior and improve engagement strategies based on performance metrics.
Best Practices for Using the Fundraising Campaign KPI Dashboard
Click to Fundraising Campaign KPI
Customize KPIs According to Your Campaign
Each fundraising campaign has unique goals. Ensure your KPIs reflect the specific objectives of your initiative.
Regularly Update Actual, Target, and Previous Year Data
Keep your dashboard relevant by entering updated data consistently.
Use Conditional Formatting for Easy Insights
Take advantage of up/down arrows and color coding to quickly assess KPI trends.
Review Monthly and Annual Trends
Analyze KPI trends using the KPI Trend Sheet to make proactive decisions.
Ensure Data Accuracy Before Making Decisions
Double-check inputs in the Actual Numbers, Target, and Previous Year Sheets to avoid misinterpretation of data.
Conclusion
A Fundraising Campaign KPI Dashboard in Excel is a powerful tool for tracking and optimizing your fundraising efforts. By leveraging its features, you can effectively monitor progress, identify trends, and enhance donor engagement. Whether you’re managing a small nonprofit drive or a large-scale fundraising campaign, this dashboard will help you make data-driven decisions and achieve your financial goals.
Frequently Asked Questions (FAQs)
What is a KPI in fundraising?
A Key Performance Indicator (KPI) is a measurable value that indicates how effectively your fundraising campaign meets its objectives.
Which KPIs should I track in my fundraising campaign?
Common KPIs include Total Donations, Donor Retention Rate, Average Gift Size, Conversion Rate, and Fundraising ROI.
Can I customize this KPI Dashboard for different fundraising campaigns?
Yes! You can modify KPIs, targets, and actuals based on your specific campaign needs.
How often should I update the KPI dashboard?
It’s best to update data monthly to maintain accurate insights and track progress effectively.
Does this dashboard require advanced Excel knowledge?
No, it is designed with an easy-to-use interface and dropdown selections for smooth navigation and data entry.
Can I visualize KPI trends over time?
Yes! The KPI Trend Sheet includes trend charts for MTD and YTD values, helping you analyze performance over time.
Click to Fundraising Campaign KPI
Visit our YouTube channel to learn step-by-step video tutorials
View this post on Instagram