Gaming has become a booming industry, and tracking key performance indicators (KPIs) is crucial for success. Whether you’re a gaming studio, e-sports team, or game developer, having a Gaming KPI Dashboard in Power BI allows you to monitor performance effectively. This dashboard helps you track real-time metrics, analyze trends, and make data-driven decisions.
In this guide, we’ll explore how to build a powerful Gaming KPI Dashboard using Power BI. We’ll cover key features, best practices, and frequently asked questions to ensure you get the most out of your dashboard.
Click to Gaming KPI
Why Use a Gaming KPI Dashboard?
A Gaming KPI Dashboard provides insights into key areas such as player engagement, revenue, and game performance. Here’s why you need one:
- Track KPIs in Real-Time – Monitor game performance, user activity, and revenue trends effortlessly.
- Improve Decision-Making – Get actionable insights to enhance player retention and boost sales.
- Identify Trends – Analyze user behavior to optimize in-game experiences.
- Optimize Game Strategy – Adjust marketing and development efforts based on performance metrics.
Key Features of the Gaming KPI Dashboard
This Power BI Gaming KPI Dashboard includes three main pages:
Click to Gaming KPI
Summary Page – Overview of KPIs
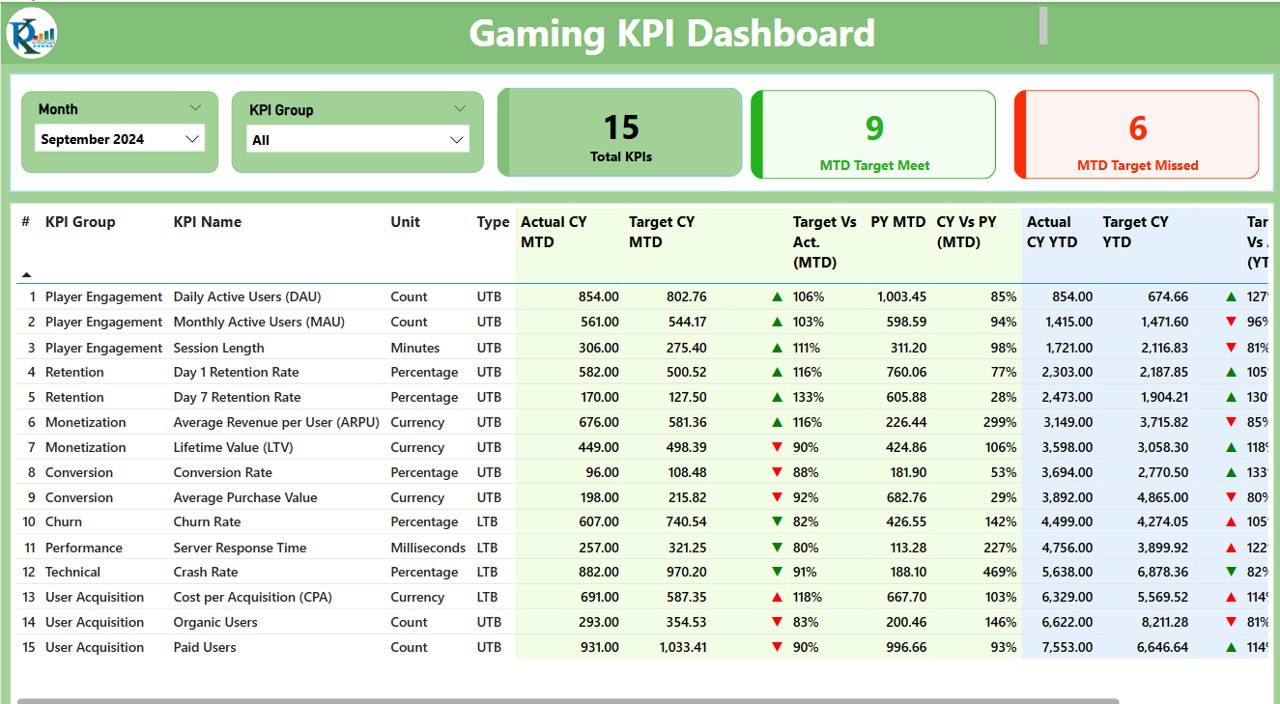
This is the main dashboard page, where you can analyze gaming KPIs with slicers and visualizations.
- Slicers: Filter by Month and KPI Group for precise data visualization.
- KPI Summary Cards:
Total KPIs Count
- MTD (Month-to-Date) Target Met Count
- MTD Target Missed Count
- Detailed KPI Table: Includes the following key columns:
- KPI Number: Sequence number of KPI
- KPI Group: Category of KPI (e.g., Engagement, Revenue, Performance)
- KPI Name: Specific KPI being tracked
- Unit: Measurement unit (e.g., Percentage, Count)
- Type: LTB (Lower The Better) or UTB (Upper The Better)
- Actual CY MTD: Current Year MTD actual values
- Target CY MTD: Target values for MTD
- Target Vs Actual (MTD): Performance percentage (Actual/Target)
- CY Vs PY (MTD): Comparison of current year and previous year’s MTD performance
- YTD Metrics: Year-to-Date actuals, targets, and performance trends
- Trend Icons: Red 🔻 for decline, Green 🔺 for improvement
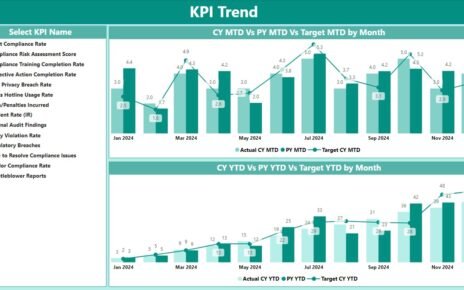
KPI Trend Page – Performance Over Time
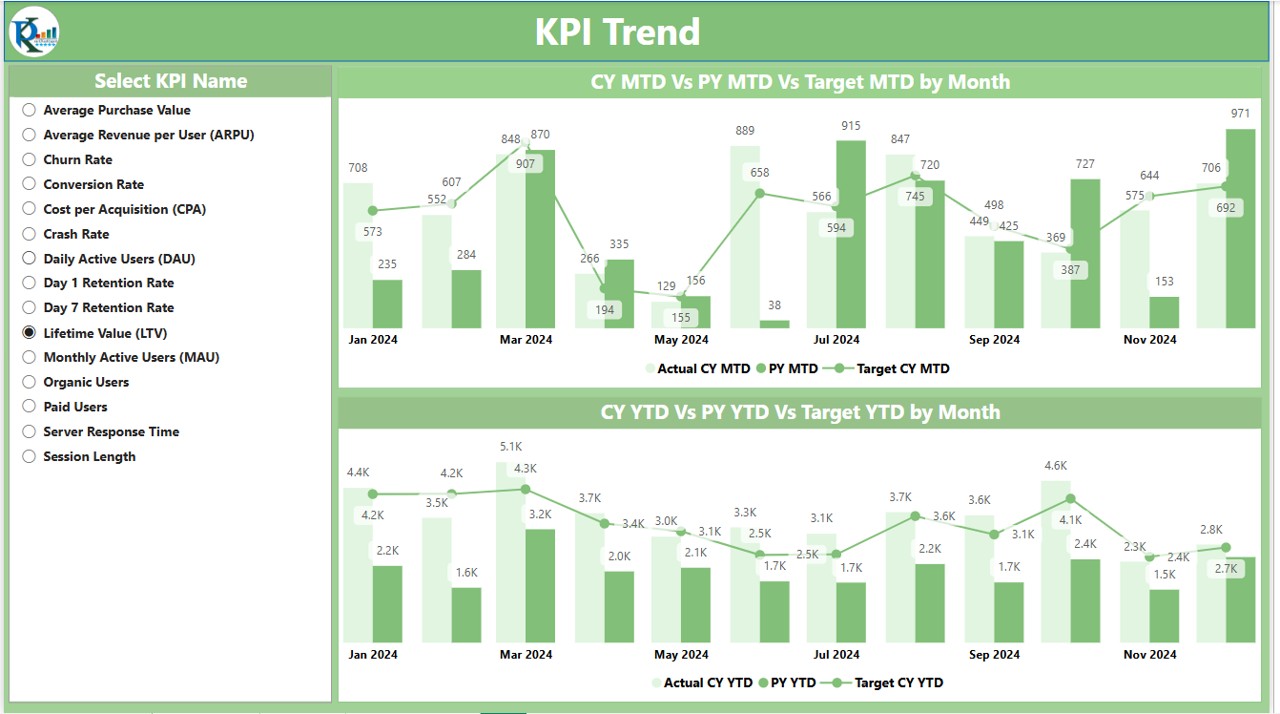
This page provides a deeper analysis of KPI trends over time using visual charts.
- 2 Combo Charts: Display actual vs. target values for both MTD and YTD.
- Slicer: Allows users to filter and analyze specific KPIs.
KPI Definition Page – Detailed KPI Breakdown
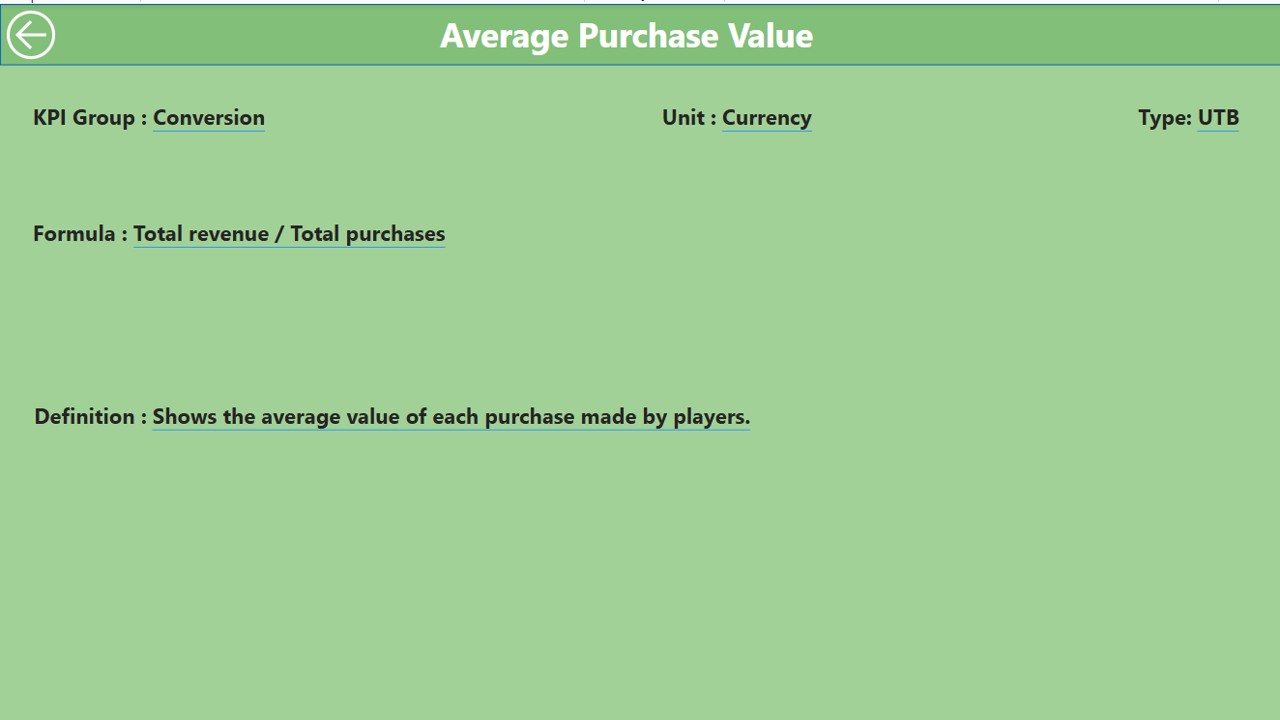
This is a hidden drill-through page containing KPI definitions and formulas. Users can click on any KPI from the Summary Page to drill through for more information.
- Definition & Formula: Explains how each KPI is calculated.
- Back Button: Easily navigate back to the Summary Page.
Data Source – Excel Integration
- The dashboard is powered by an Excel data source with three main sheets:
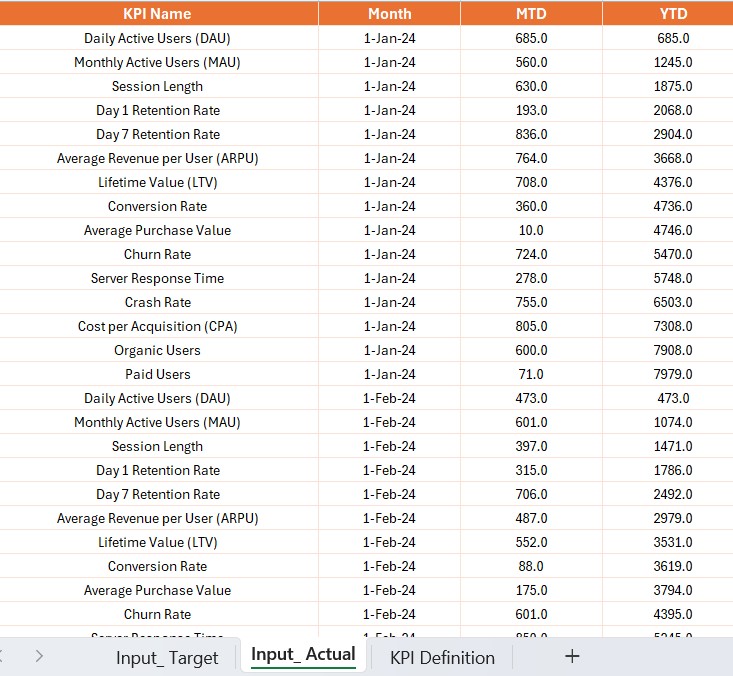
Input Actual Sheet
- Enter actual KPI numbers for each month.
- Include KPI Name, Month, MTD values, and YTD values.
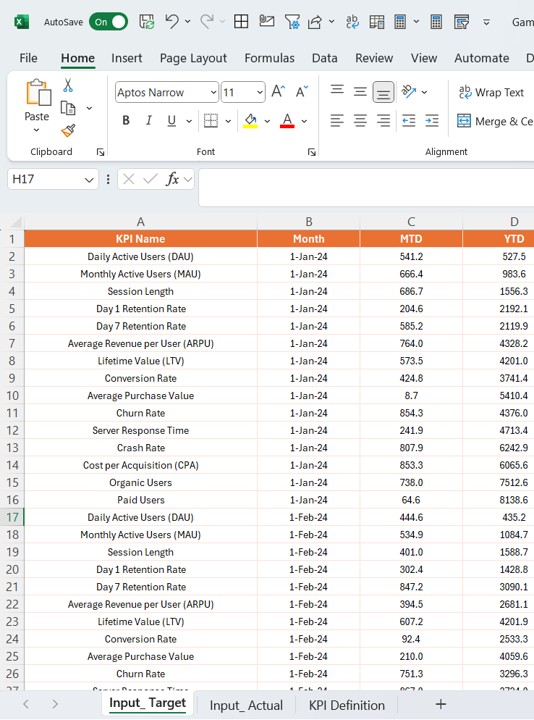
Input Target Sheet
- Enter target KPI numbers for each month.
- Include KPI Name, Month, MTD values, and YTD values.
Click to Gaming KPI
KPI Definition Sheet
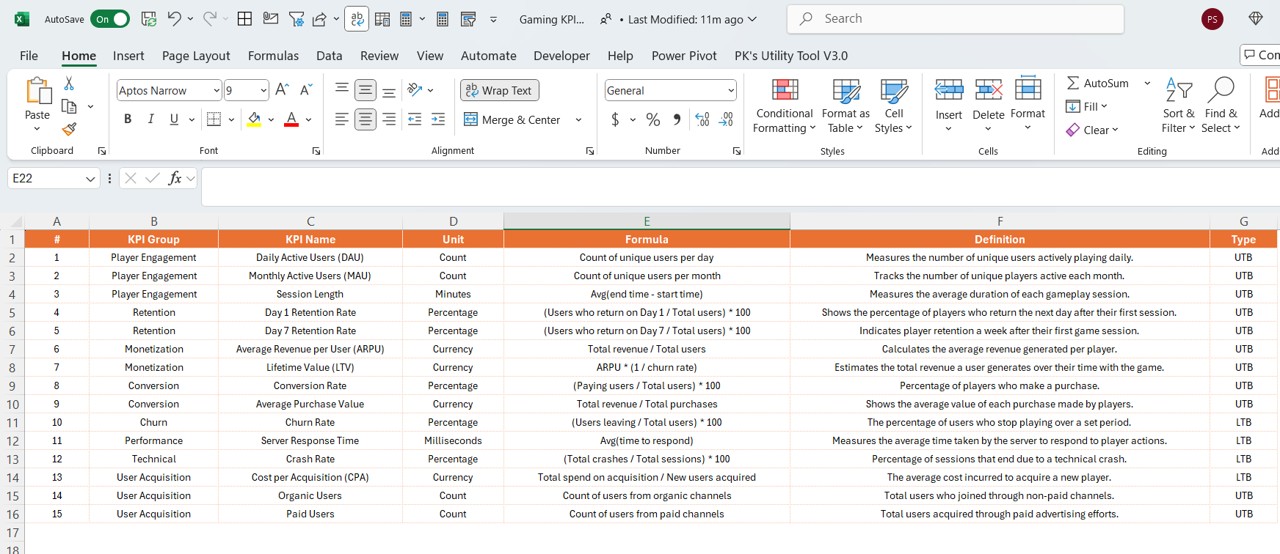
- Define each KPI with:
- KPI Number
- KPI Group
- KPI Name
- Unit of Measurement
- Formula for Calculation
- KPI Type (LTB or UTB)
Advantages of a Gaming KPI Dashboard
- Enhanced Data Visibility – Get real-time insights into gaming performance.
- Better Decision-Making – Identify trends and adjust strategies accordingly.
- Improved Player Retention – Optimize game features based on user engagement data.
- Revenue Optimization – Track revenue KPIs and adjust monetization strategies.
- Competitive Edge – Stay ahead of competitors by leveraging key insights.
Best Practices for Using the Gaming KPI Dashboard
- Keep Data Updated – Regularly update the Excel file to ensure accurate insights.
- Use Slicers Effectively – Filter data by month and KPI groups to focus on key metrics.
- Monitor Trends – Analyze the KPI Trend Page to detect emerging patterns.
- Leverage Drill-Through Pages – Use the KPI Definition Page for a deeper understanding of KPI calculations.
- Automate Data Refresh – Enable auto-refresh in Power BI to keep data up-to-date.
Conclusion
A Gaming KPI Dashboard in Power BI is an invaluable tool for tracking gaming performance. It provides actionable insights, improves player engagement, and boosts revenue. By integrating real-time data and trend analysis, gaming companies can optimize their strategies effectively.
Frequently Asked Questions (FAQs)
What is a Gaming KPI Dashboard?
A Gaming KPI Dashboard is a visual tool in Power BI used to monitor key performance indicators (KPIs) related to gaming, including player engagement, revenue, and performance metrics.
How does Power BI help in game analytics?
Power BI helps by providing real-time insights, tracking player behavior, and analyzing trends using interactive visuals and slicers.
Can I customize the KPIs in this dashboard?
Yes! You can modify KPIs, formulas, and visualization elements to match your gaming business needs.
Is it possible to automate data updates in Power BI?
Yes, you can schedule automatic refreshes to ensure your data stays up-to-date.
How do I get started with this dashboard?
Simply upload your Excel data file into Power BI, connect it to the dashboard, and start analyzing your KPIs instantly.
Click to Gaming KPI
Visit our YouTube channel to learn step-by-step video tutorials
View this post on Instagram