Home>Blogs>Charts and Visualization>Horizontal Timeline Chart using Scatter chart in Excel>Horizontal Timeline Chart-2
Horizontal Timeline Chart-2
05
Jul 2019
1914Comments Off on Horizontal Timeline Chart-2
PK
Meet PK, the founder of PK-AnExcelExpert.com! With over 15 years of experience in Data Visualization, Excel Automation, and dashboard creation. PK is a Microsoft Certified Professional who has a passion for all things in Excel. PK loves to explore new and innovative ways to use Excel and is always eager to share his knowledge with others. With an eye for detail and a commitment to excellence, PK has become a go-to expert in the world of Excel. Whether you're looking to create stunning visualizations or streamline your workflow with automation, PK has the skills and expertise to help you succeed. Join the many satisfied clients who have benefited from PK's services and see how he can take your Excel skills to the next level!
https://www.pk-anexcelexpert.com
Related Articles
Pension Fund KPI Dashboard in Excel
Managing pension funds efficiently requires robust tracking of key performance indicators (KPIs). A Pension Fund KPI Dashboard in Excel is
Warehouse Management KPI Dashboard in Power BI
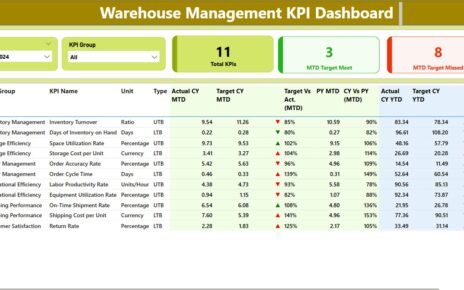
Warehouse management is a crucial part of any supply chain, ensuring seamless inventory tracking, optimizing storage, and improving operational efficiency.
Search Text from Specific or all columns in Excel
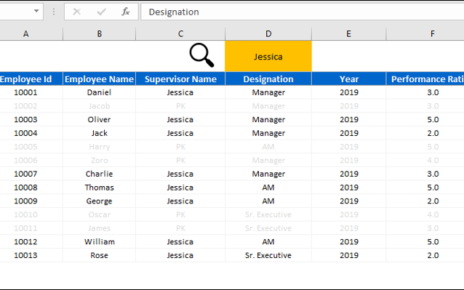
In this article, you will learn how to use Advanced Conditional Formatting to search text in data. Here we have