Have you ever wondered if you could use Excel for more than just numbers? Well, Excel has some pretty cool features that you may not know about, and one of them is the Geography Option in Excel with Example. This tool lets you easily pull up real-world information like country flags or other data. In this guide, I’ll show you how to use the Geography option step by step. It’s a simple way to make your Excel sheets more informative and visually engaging.
Why Should You Use the Geography Option in Excel?
You might be thinking, “Why should I even bother with the Geography option?” The answer is simple: Excel allows you to work with real-world data in ways that are both practical and visually interesting. By using the Geography option, you can quickly find useful information like country flags, regions, or populations. This can save you tons of time if you’re working with global data. Plus, it’s a great way to impress your colleagues or friends!
Now, let’s jump right into how to use this feature with a real-world example.
Geography Option in Excel with Example

Step 1: Prepare Your Data
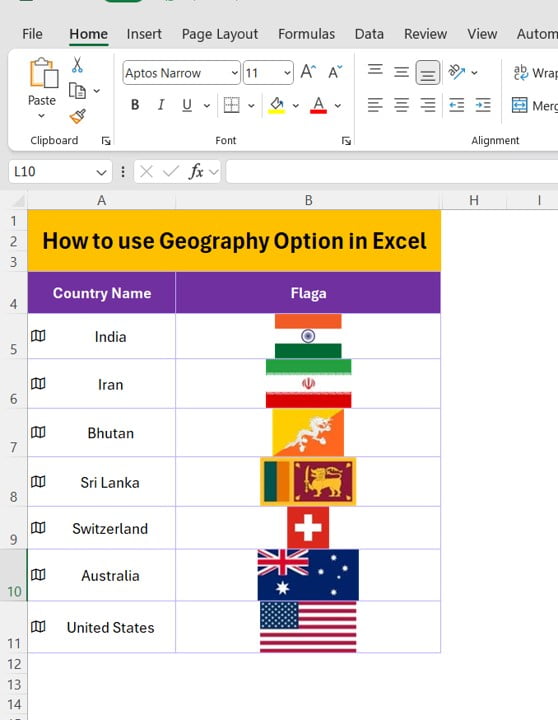
Before we get started, we need to set up our data. Let’s say you have a list of country names, and you want to add their flags. It’s super easy to do this using the Geography option in Excel.
Step 2: Apply the Geography Data Type
Now that we have our country names in place, it’s time to use the Geography option in Excel. Here’s how to do it:
- First, select the cells with the country names. In our example, this would be cells A4 to A11.
- Next, go to the Data tab in Excel.
- Look for the group of options that says Data Types and click on Geography.
Once you do this, Excel will recognize that these are country names and convert them into rich geographic data. You’ll see little map icons appear next to each country name. Pretty cool, right?
Step 3: Find the Country Flags
Now that we’ve set up the Geography data type, let’s move on to the exciting part—retrieving the country flags!
- Click on one of the map icons next to the country names.
- A small box will pop up showing you different kinds of data you can pull up. Look for the Flag option.
- Select Flag, and Excel will automatically add the country flag in the next column.
That’s it! You’ve just pulled real-world country flags into your Excel sheet, all without leaving the program.
Example in Action
Here’s what our updated table looks like after using the Geography option:
Note: The flags shown here are just placeholders. In Excel, you’ll see the actual flag images.
Why You’ll Love This Feature
The Geography option is incredibly useful, and here’s why:
- Saves Time: You don’t need to search for flags or other geographic data manually. Excel does it for you in seconds!
- Accurate Data: Excel pulls data from trusted sources, so you know the information is reliable.
Adds Visual Appeal: Using flags or other data makes your reports look professional and engaging.
Wrapping It Up
And there you have it! The Geography option in Excel is a handy feature that can save you time and make your data more interesting. Whether you’re working on a project for school, a report for work, or just playing around with Excel, this feature can make your spreadsheets stand out.
Want to see this process in action? Check out our video tutorial on YouTube: How to Use Geography Option in Excel with Example.
Visit our YouTube channel to learn step-by-step video tutorials
View this post on Instagram


