Are you ready to level up your Excel game? Today, we’re going to explore one of Excel’s most powerful tools—the FILTER Function in Excel with Examples This function is a real lifesaver when you’re working with large amounts of data and need to quickly find specific information. In this blog post, I’ll Walk you through a practical example that shows how easy it is to use the FILTER Function in Excel with Examples rows and columns in Excel. So, let’s dive right in!
Why Should You Use the FILTER Function?
Before we get into the details, let’s take a moment to understand why the FILTER function is such a valuable tool in Excel. Picture this: you’re managing a big inventory list with tons of products, and you need to figure out which items are in stock, out of stock, or have a specific quantity. Manually scrolling through rows of data to find what you need can be both time-consuming and frustrating, not to mention the risk of making mistakes. Fortunately, the FILTER function makes this task incredibly easy by automatically filtering your data based on specific criteria. This means you can get exactly the information you need, with just a few simple steps.
The Data We’ll Be Working With filter
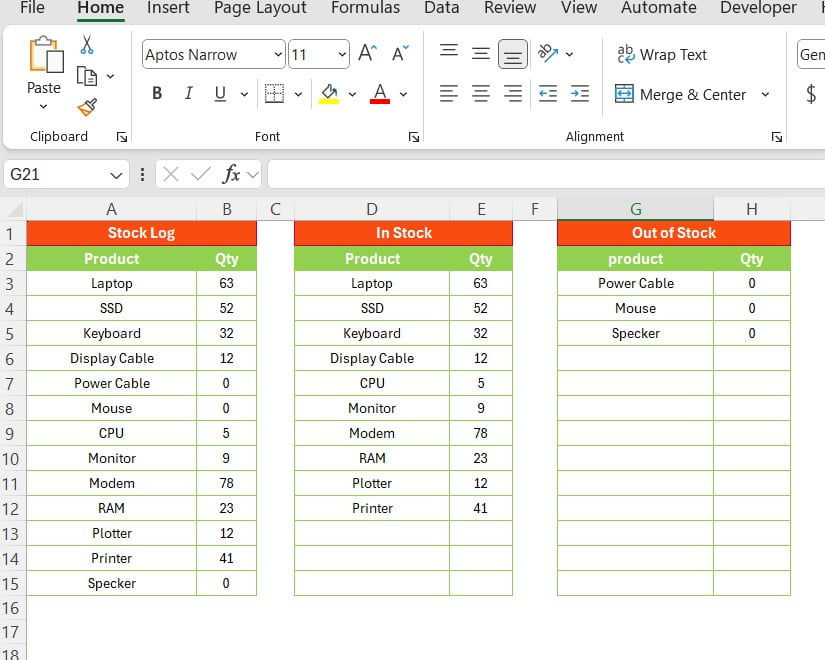
Now, let’s talk about the data we’ll be using in our example. We have a basic inventory dataset that includes three main columns: Stock Log, In Stock, and Out of Stock. Each column lists different products along with their quantities. Here’s a quick overview of the data:
How to Filter the Data:
Now that we’ve got our data laid out, it’s time to have some fun with the FILTER function! This function allows us to zero in on a specific subset of our data based on certain criteria we set. Let’s go through a couple of practical examples to see how this works.
Filtering Products That Are in Stock:
How to use in FILTER Function in Excel with Examples First up, let’s find out which products are in stock—specifically, those with a quantity greater than 0. To do this, we’ll use the following formula:
=FILTER (A2:B15, B2:B15>0)
So, what’s happening here? This formula is telling Excel to look at the range A2
(where our product names and quantities are stored) and filter out only the rows where the quantity in column B is greater than 0.
Here’s what Excel will show you:
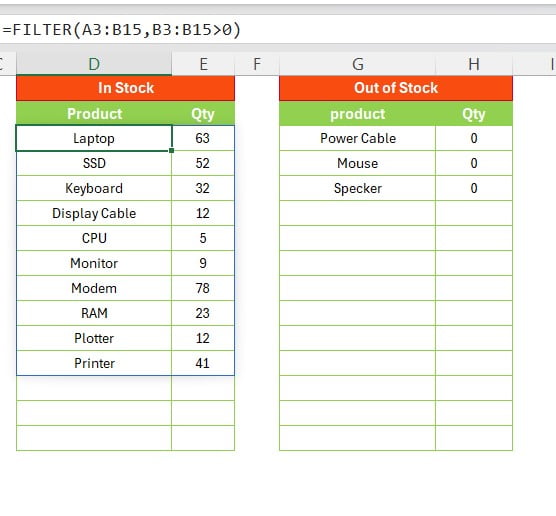
As you can see, Excel has pulled up all the products that are currently in stock. Easy, right?
Filtering Products That Are Out of Stock
Now, let’s switch gears and filter out the products that are out of stock—those with a quantity of 0. The formula for this is just a little bit different:
=FILTER (A2:B15, B2:B15=0)
What’s different here? Instead of filtering for quantities greater than 0, this formula filters for quantities that are exactly 0.
And here’s what you’ll get:
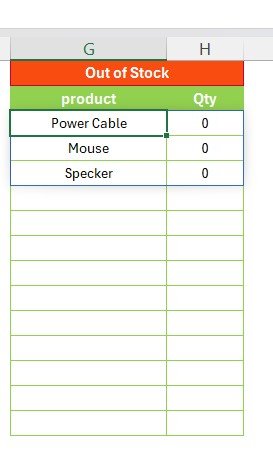
Now, you have a clear list of products that are currently out of stock.
Why This Matters to You
So, why should you care about the FILTER function? Simply put, it saves you time and helps you avoid mistakes. Instead of manually searching or sorting through your data, you can let Excel do all the work for you. This function is a must-have for anyone who deals with large datasets or needs to make quick decisions based on filtered information.
Wrapping It Up:
The FILTER function in Excel is a powerful tool that can make data management a breeze. Whether you’re working with inventory, financial data, or any other type of list, this function can help you find the information you need in no time. I hope this example has shown you just how easy and useful the FILTER function can be.
If you found this guide helpful, don’t forget to check out our YouTube video for a deeper dive into the FILTER function. And of course, subscribe to our channel for more Excel tips and tricks!
Visit our YouTube channel to learn step-by-step video tutorials
View this post on Instagram