When working with large sets of data in Excel, especially when you need to organize them in a specific layout, Excel’s WRAPROWS Function in Excel function becomes incredibly handy. In this blog post, I’ll Walk you through how to use the WRAPROWS function in Excel using real-world examples. Let’s dive in and explore how to transform your data for better visibility and organization!
What is the WRAPROWS Function in Excel?
The WRAPROWS function allows you to reshape a single column of data into multiple rows, giving you more control over how you display your information. Instead of manually moving cells around, WRAPROWS Function in Excel can automatically arrange your data based on your preferences.
Think of it this way: If you have a long list of data, you can “wrap” it into rows to make it easier to view. This is especially helpful when you’re working with datasets that are vertically aligned and you’d like to display them horizontally.
WRAPROWS Function: A Practical Example

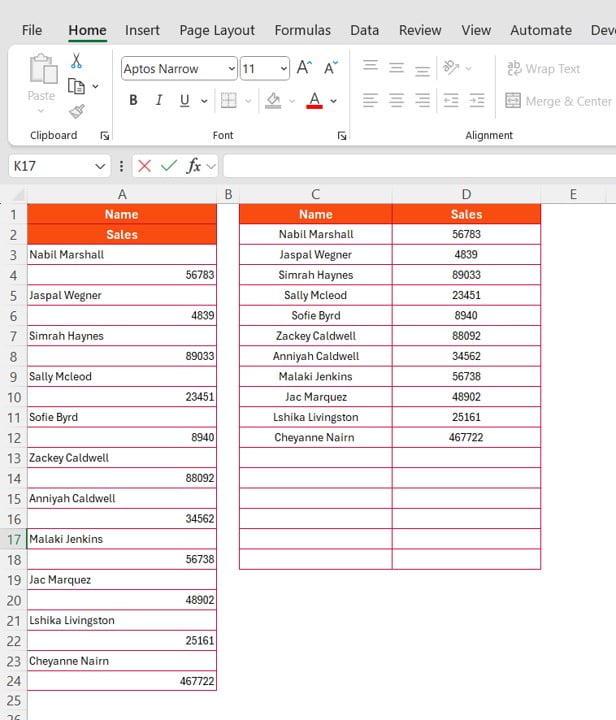
For this example, let’s use a simple dataset containing two columns: Name and Sales.
The Problem We’re Solving
Imagine you want to wrap this list of names and their corresponding sales into rows, so it’s easier to read or compare at a glance. Manually copying and pasting data into new rows is time-consuming, especially for larger datasets. Here’s where the WRAPROWS function steps in.
The Formula Breakdown

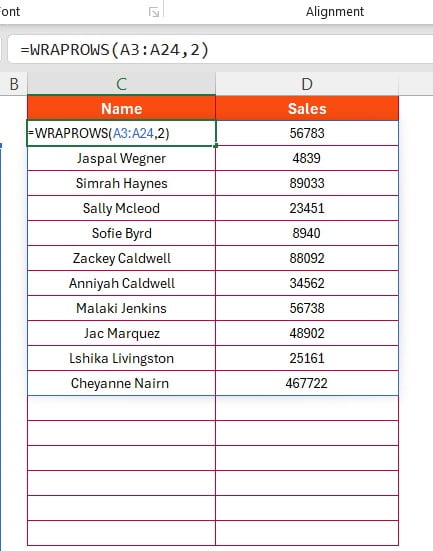
The WRAPROWS function helps you reshape your data with ease. To implement this, simply use the following formula:
=WRAPROWS (A3:A24, 2)
This formula takes the data range (from cell A3 to A24) and arranges the values into rows with 2 columns each.
Understanding the Output
Once you apply the formula, Excel will automatically transform your data from a vertical column into a horizontal layout, where every two values from the original column form a pair of rows.
This layout is much easier to navigate compared to the original single-column data!
Why Should You Use the WRAPROWS Function?
The WRAPROWS function is more than just a convenient tool—it’s essential when handling large datasets. Here are some key reasons why you’ll love using WRAPROWS:
- Timesaving: No need to manually rearrange data, WRAPROWS does it for you in seconds.
- Enhanced Readability :Viewing data in rows instead of long columns helps make comparisons easier and faster.
- Improved Data Organization: Organize data to fit your needs, whether it’s for presentation or further analysis.
Conclusion:
Excel’s WRAPROWS Function in Excel is a fantastic way to enhance the way you view and manage your data. By transforming vertical lists into more structured rows, you’ll be able to organize and interpret data more efficiently.
If you found this tutorial helpful, be sure to check out our YouTube video for a step-by-step walkthrough and more examples on how to use this feature effectively.
By mastering the WRAPROWS function, you’re taking another step toward Excel proficiency—one function at a time!
Visit our YouTube channel to learn step-by-step video tutorials
View this post on Instagram
Click hare to download the practice file


