In today’s fast-paced business environment, HR professionals must keep track of employee performance, attendance, training, and salary data—all in one place. That’s where the HR Performance Dashboard in Excel comes into play. It brings clarity to complex HR metrics and allows managers to make quick, data-driven decisions.
This article will walk you through the complete structure, benefits, best practices, and frequently asked questions about the HR Performance Dashboard in Excel. Whether you’re new to Excel dashboards or a seasoned HR analyst, this guide will show you exactly how this tool can transform your workflow.
Click to purchase HR Performance Dashboard
What is an HR Performance Dashboard in Excel?
An HR Performance Dashboard in Excel is a dynamic, visual report that displays essential HR data like employee attendance, training hours, performance scores, salary analytics, and more. It uses charts, slicers, and pivot tables to simplify data interpretation, making it easier to monitor trends and improve workforce management.
Key Features of the HR Performance Dashboard
Let’s begin by breaking down the primary features that make this dashboard truly stand out:
Page Navigator (Left Side)
- You don’t need to scroll endlessly to find insights. With the Page Navigator on the left, you can switch between five analytical pages instantly.
Slicers (Right Side)
Four interactive slicers allow you to filter data by:
- Gender
- Department
- Job Title
- Location
These filters instantly update the dashboard visuals, giving you focused insights.
Click to purchase HR Performance Dashboard
Overview Page: Get the Big Picture Fast
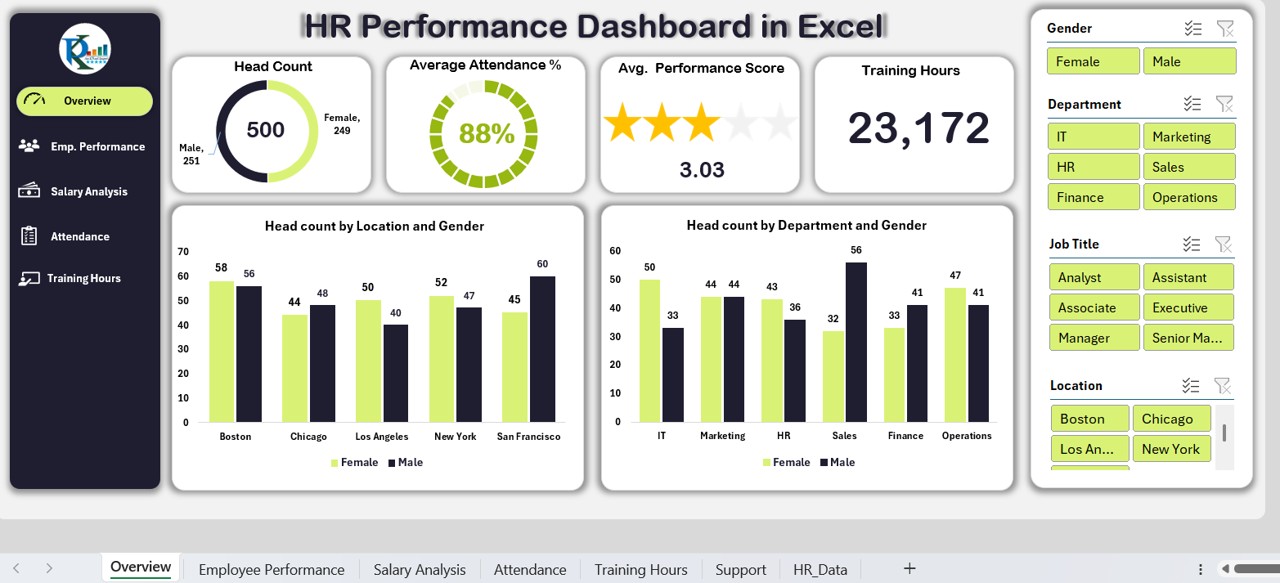
The Overview Page serves as your quick snapshot of the HR department. It includes six comprehensive charts:
- Headcount by Male/Female: See the gender diversity at a glance.
- Average Attendance %: Understand employee consistency.
- Average Performance Score: Gauge the overall productivity.
- Training Hours: Track investment in employee growth.
- Headcount by Location & Gender: Assess workforce distribution.
- Headcount by Department & Gender: Spot departmental gender trends.
- This page helps HR teams identify gaps and celebrate achievements at the organizational level.
Employee Performance Page:
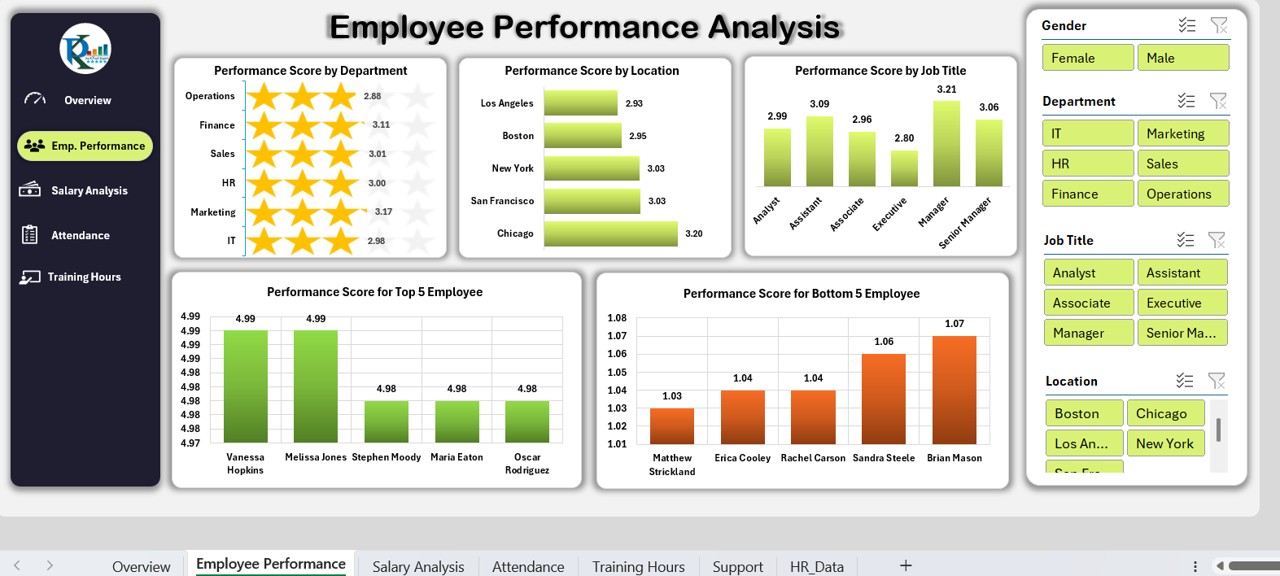
Dive deeper into individual and departmental performance with five insightful charts:
- Performance Score by Department
- Performance Score by Location
- Performance Score by Job Title
- Top 5 Employees by Performance
- Bottom 5 Employees by Performance
These visuals allow you to reward high performers and offer support where needed.
Salary Analysis Page: Know Your Compensation Trends
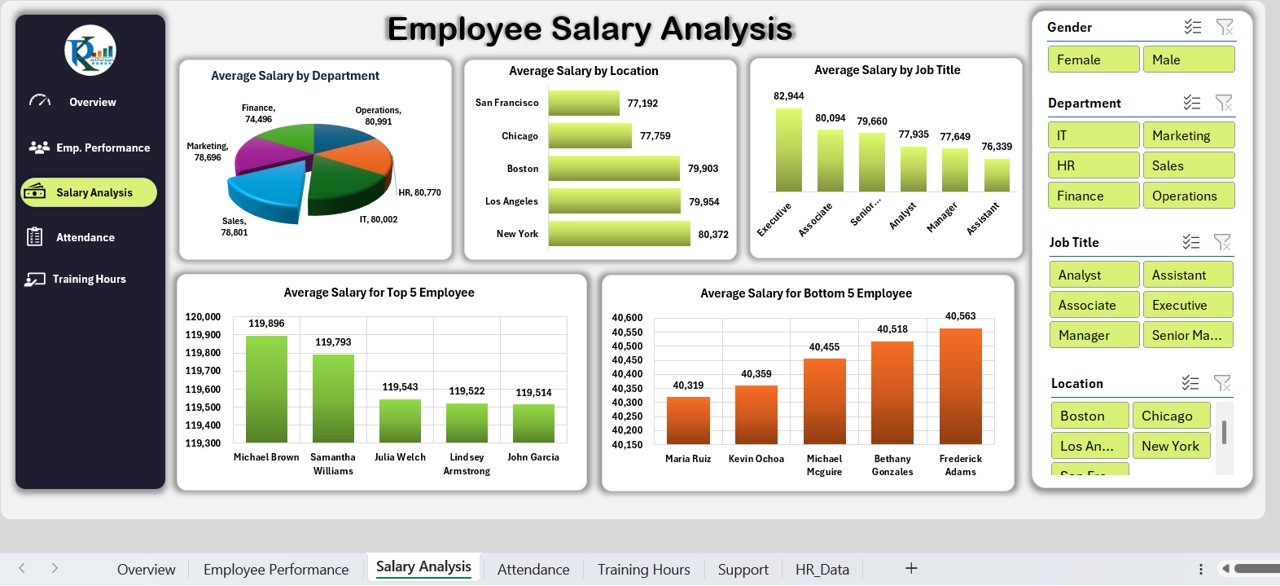
On this page, salary data turns into powerful insights with five key charts:
- Average Salary by Department
- Average Salary by Location
- Average Salary by Job Title
- Top 5 Highest Paid Employees
- Bottom 5 Lowest Paid Employees
This helps in maintaining fair pay and identifying salary gaps across roles and departments.
Click to purchase HR Performance Dashboard
Attendance Page: Monitor Reliability
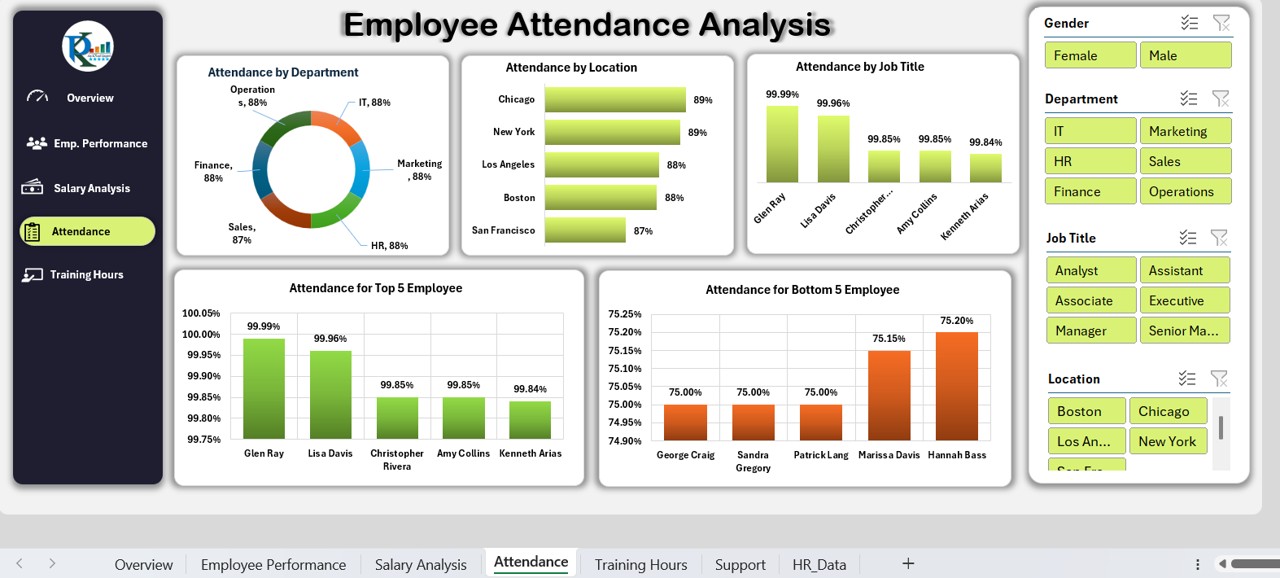
Track how attendance trends vary across the organization with five charts:
- Attendance by Department
- Attendance by Location
- Attendance by Job Title
- Top 5 Employees with Best Attendance
- Bottom 5 Employees with Poor Attendance
Use this data to support policy changes or offer attendance-related incentives.
Click to purchase HR Performance Dashboard
Training Hours Page: Invest in Growth
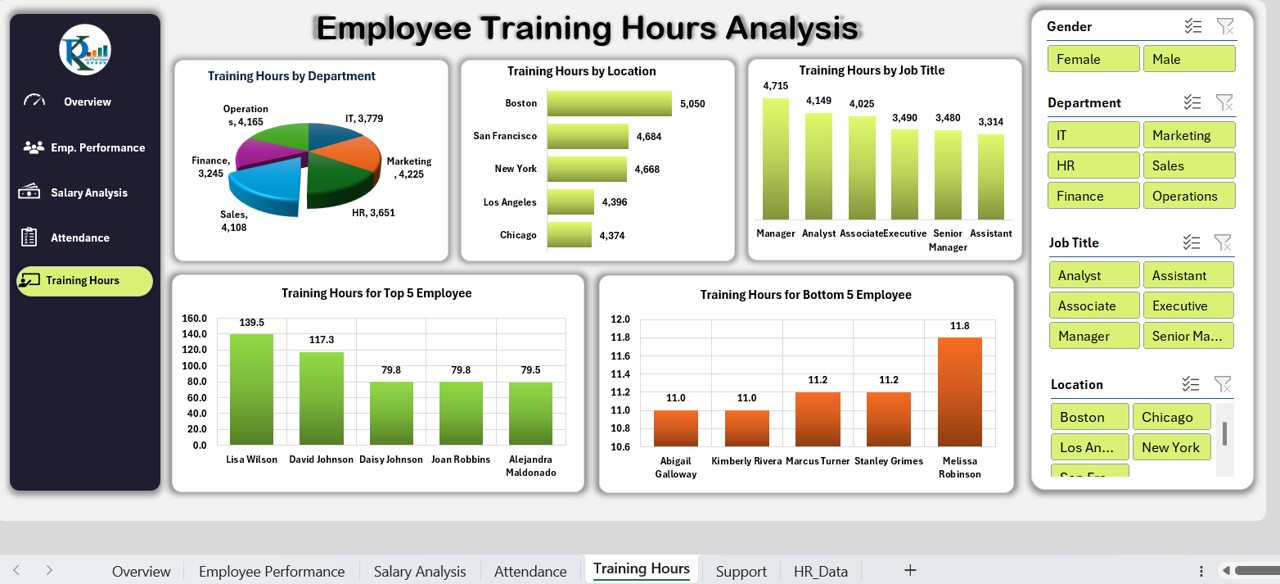
Check how training hours are distributed throughout your company:
- Training Hours by Department
- Training Hours by Location
- Training Hours by Job Title
- Top 5 Employees by Training Hours
- Bottom 5 Employees by Training Hours
You can ensure that every team and employee gets equal training opportunities.
Support Sheet Tab
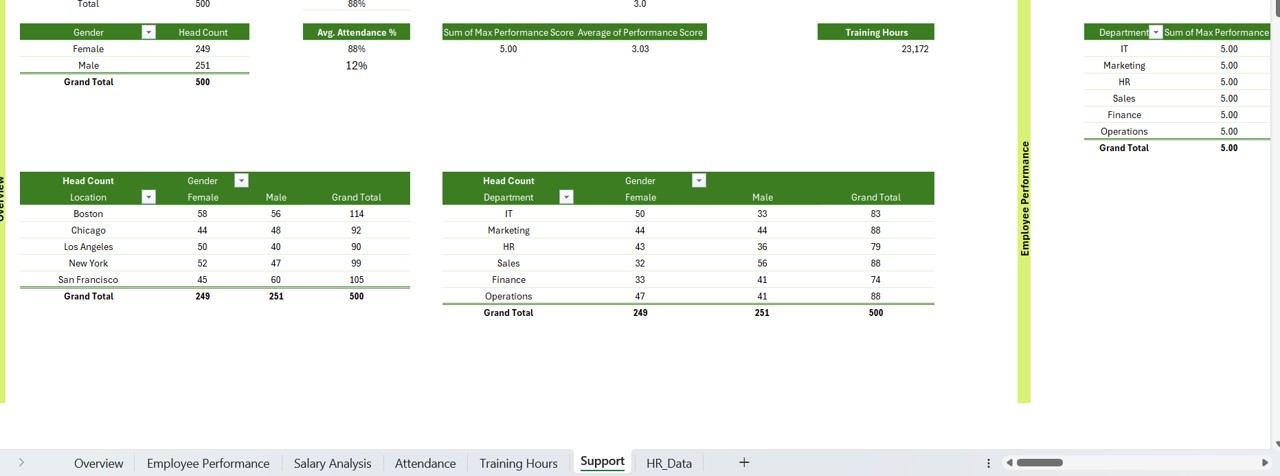
This hidden tab stores all the Pivot Tables used for chart creation. You don’t need to make changes here—just let it do the heavy lifting behind the scenes.
HR Data Sheet Tab: The Backbone
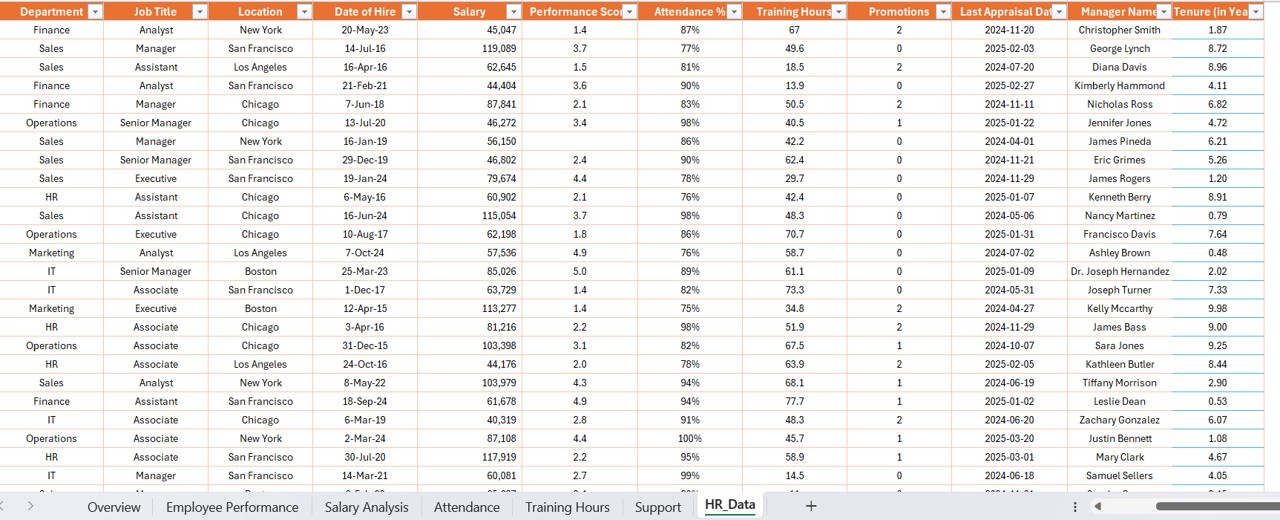
This is your main data entry area. It includes crucial fields like:
- Employee ID
- Employee Name
- Gender
- Department
- Job Title
- Location
- Date of Hire
- Salary
- Performance Score
- Attendance %
- Training Hours
- Promotions Last
- Appraisal Date
- Manager Name
- Tenure (in Years)
Update this sheet regularly to keep your dashboard up-to-date.
Advantages of HR Performance Dashboard in Excel
Click to purchase HR Performance Dashboard
Why should you use this dashboard? Here are the top reasons:
✅ Instant nights: View everything from performance to pay at a glance.
✅ Data-Driven Decisions: Back up HR policies with real data.
✅ User-Friendly: No need for complex tools; Excel does it all.
✅ Customizable: Add or remove fields based on your company needs.
✅ Improves Accountability: Helps track both team and individual KPIs.
Best Practices for HR Performance Dashboard
Want to make the most of your dashboard? Follow these tips:
- Keep your data clean: Regularly audit and update the HR Data Sheet.
- Train your HR team: Ensure everyone knows how to use slicers and read charts.
- Schedule updates: Refresh pivot tables and charts weekly or monthly.
- Use filters wisely: Apply slicers one at a time for clear insights.
- Back up your file: Store versions in a secure cloud or external drive.
How Can This Dashboard Improve HR Operations?
This Excel dashboard helps streamline HR operations by reducing manual reporting and focusing on visuals that tell stories. You can:
- Spot trends early
- Take preventive actions on poor attendance
- Design training programs
- Align performance reviews with real data
How to Get Started with the HR Performance Dashboard?
- Download the dashboard template.
- Input your employee data into the HR Data Sheet.
- Navigate through the dashboard pages.
- Apply slicers for filtered views.
- Analyze, present, and take action!
Conclusion
The HR Performance Dashboard in Excel is more than just a reporting tool. It’s your all-in-one system for tracking employee progress, enhancing transparency, and making better HR decisions. When used right, it can help transform your HR department into a data-driven powerhouse.
If you’re looking to simplify and supercharge your HR analytics, this dashboard is the perfect starting point.
Frequently Asked Questions (FAQs)
Can I customize the HR Performance Dashboard?
Yes, the Excel dashboard is fully customizable. You can add more columns in the data sheet and create new visuals as needed.
Is this dashboard suitable for small companies?
Absolutely! It works for small, medium, and large teams alike. Simply adjust the data size.
Do I need advanced Excel skills to use this dashboard?
Not at all. Basic Excel knowledge is enough to navigate, filter, and interpret the dashboard.
How often should I update the HR Data Sheet?
We recommend updating it weekly or monthly depending on your reporting needs.
Can I track multiple departments with this dashboard?
Yes. The slicers and department-wise charts make it easy to monitor all departments individually.
Click to purchase HR Performance Dashboard
Visit our YouTube channel to learn step-by-step video tutorials