In today’s highly competitive business environment, companies cannot afford to overlook customer engagement. Especially in the Human Resources (HR) department, focusing on how employees engage with internal and external customers is crucial. One powerful tool to track and improve this engagement is the Human Resources Customer Engagement KPI Dashboard in Excel.
This article will walk you through everything you need to know about this dashboard, from its key features and advantages to best practices for using it effectively. Plus, we will answer some common questions at the end to make sure you leave with complete clarity!
What is the Human Resources Customer Engagement KPI Dashboard in Excel?
The Human Resources Customer Engagement KPI Dashboard in Excel is a ready-to-use, dynamic template designed to help HR teams track, monitor, and improve their engagement efforts.
Click to Purchases Human Resources Customer Engagement KPI Dashboard in Excel
It provides a visual summary of important Key Performance Indicators (KPIs) such as employee responsiveness, internal service levels, communication effectiveness, and satisfaction scores — all in one place.
By using this dashboard, HR teams can easily identify performance gaps, make informed decisions, and boost customer engagement strategies within the organization.
Key Features of the Human Resources Customer Engagement KPI Dashboard
The dashboard includes seven powerful worksheet tabs, each serving a specific purpose to ensure smooth tracking and reporting:
Home Sheet

- Acts as the index page.
- Includes 6 buttons that provide quick navigation to different sheets.
- Makes the entire dashboard user-friendly and organized.
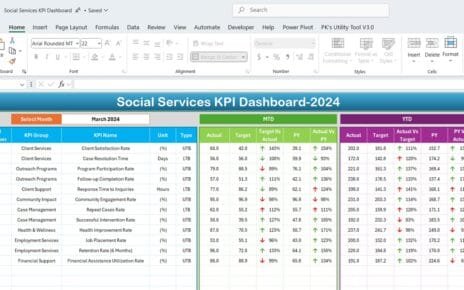
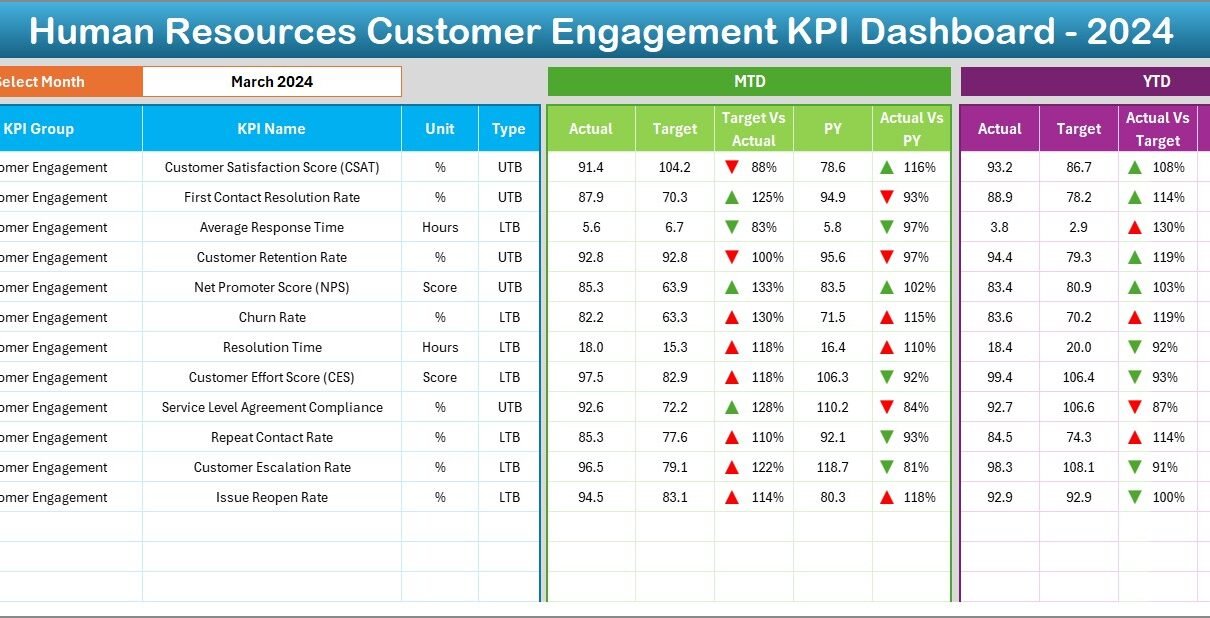
Dashboard Sheet Tab

- The main highlight of the tool.
- Displays all the important KPIs in one glance.
- Dropdown in D3 to select any month — the entire dashboard updates dynamically.
- Displays MTD (Month-To-Date) and YTD (Year-To-Date) actuals, targets, and previous year data.
- Conditional formatting shows up and down arrows, making it easy to spot trends.
KPI Trend Sheet Tab

- Helps you analyze historical trends.
- Simply select the KPI in cell C3.
- Shows important details like KPI Group, Unit, Type (Lower the Better or Upper the Better), Formula, and Definition.
- Displays MTD and YTD trend charts for Actuals, Targets, and Previous Year numbers.
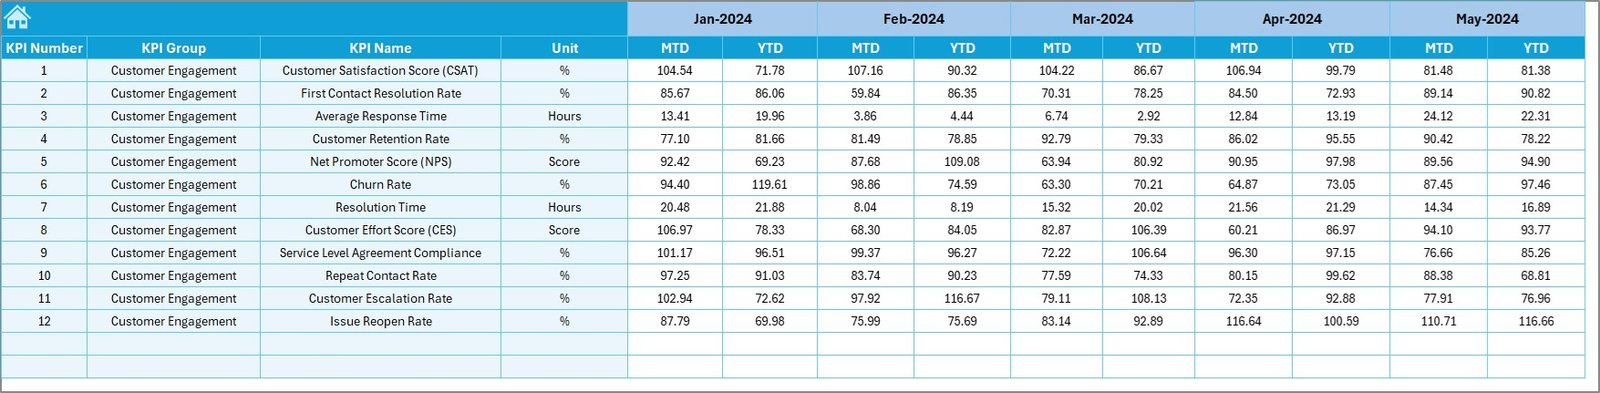
Actual Numbers Input Sheet

- Input actual MTD and YTD numbers month by month.
- Change the starting month using cell E1.
- Makes data entry fast and flexible for different fiscal years.
Target Sheet Tab
- Enter your Target numbers for each KPI — both for MTD and YTD.
- Helps you set realistic benchmarks to monitor performance.
Previous Year Number Sheet Tab

- Input last year’s performance numbers.
- Allows easy year-over-year comparisons for deeper insights.
KPI Definition Sheet Tab

- Maintain a complete library of KPI details.
- Add KPI Name, Group, Unit, Formula, and Definition for reference.
Why Do You Need a Customer Engagement KPI Dashboard in HR?
Click to Purchases Human Resources Customer Engagement KPI Dashboard in Excel
Tracking customer engagement in HR is no longer optional — it’s a strategic necessity. Here’s why:
- Helps in improving service delivery to employees and stakeholders.
- Boosts employee experience, leading to better retention.
- Facilitates data-driven decisions for workforce planning.
- Identifies areas of improvement quickly.
Without a reliable dashboard, you risk losing valuable insights that can help your HR department evolve and succeed.
Advantages of Using the Human Resources Customer Engagement KPI Dashboard
Here are some clear benefits you’ll experience once you start using this dashboard:
✅ Real-Time Monitoring
See how your HR department is performing every month without waiting for lengthy reports.
✅ Data-Driven Decision-Making
Track KPIs with precision and take immediate actions based on accurate insights.
✅ Increased Accountability
Assign responsibility for each KPI, making teams more accountable.
✅ Better Resource Allocation
Focus your time and effort where it matters most by identifying weak areas quickly.
✅ Enhanced Employee Satisfaction
Improve internal service levels, communication, and responsiveness — boosting overall employee happiness.
How Does the Dashboard Work?
Let’s quickly walk through how you can get started with the dashboard:
Set up Initial Inputs
Go to the Actual Numbers Input, Target Sheet, and Previous Year Number Sheet to enter your organization’s data.
Customize the KPI Definitions
Use the KPI Definition Sheet to match KPIs with your organization’s specific goals and objectives.
Monitor Monthly Performance
Visit the Dashboard Sheet regularly, select the month from the dropdown, and see how the numbers change.
Analyze Trends
Use the KPI Trend Sheet to understand performance over time and spot any major improvements or declines.
Take Action
Based on the data, plan your next steps: employee training, policy changes, or communication improvements.
Best Practices for Using the Human Resources Customer Engagement KPI Dashboard
To make the most of this powerful Excel tool, follow these proven best practices:
Keep Your Data Up-to-Date
Make it a habit to update the Actual Numbers sheet monthly.
This ensures the dashboard reflects the latest performance.
Customize KPIs as Needed
Every organization is different.
Feel free to edit KPI names and formulas based on your unique HR objectives.
Set Clear Targets
Don’t just enter random targets.
Align targets with company goals, departmental priorities, and historical benchmarks.
Review Trends, Not Just Current Numbers
Always check the KPI Trend Sheet.
Trends tell a story that single-month numbers cannot capture.
Train Your Team
Make sure everyone involved understands how the dashboard works.
Simple training sessions can go a long way!
Automate Where Possible
If you are comfortable with Excel formulas or VBA, you can automate data updates to save time.
What KPIs Should You Track for HR Customer Engagement?
If you are unsure about what KPIs to track, here are some great examples:
- Employee Response Time (Shorter = Better)
- Internal Satisfaction Score (Higher = Better)
- Service Request Completion Rate
- Time to Resolve Employee Issues
- Training Effectiveness Score
- Employee Retention Rate
- Onboarding Satisfaction Score
- Internal Net Promoter Score (NPS)
Selecting the right KPIs will depend on your company’s focus areas and objectives.
How to Customize the Dashboard for Your Organization?
While the template is ready-to-use, a little customization can make it even more impactful:
- Modify KPI Definitions to match your specific services.
- Add Additional Charts if you want to track department-wise engagement.
- Create Alerts using conditional formatting to highlight poor performance.
- Use Dynamic Dropdowns to expand options like year selection or department filters.
Excel makes it easy to personalize your dashboard without needing any special tools or skills.
Conclusion
The Human Resources Customer Engagement KPI Dashboard in Excel is a must-have tool for any HR department serious about boosting employee satisfaction, improving internal services, and enhancing overall engagement.
By tracking the right KPIs, analyzing trends, and making informed decisions, you can truly transform your HR department into a customer-centric powerhouse.
Don’t wait to make a difference. Start tracking your engagement KPIs today and watch your HR team’s performance soar!
Frequently Asked Questions (FAQs)
What is a Customer Engagement KPI in HR?
A Customer Engagement KPI in HR measures how effectively the HR department interacts with and supports internal customers, such as employees and managers.
How Often Should I Update the KPI Dashboard?
You should update the dashboard at least once a month to keep track of the most current data and maintain accuracy.
Can I Add New KPIs to the Dashboard?
Yes, you can easily add new KPIs by updating the KPI Definition sheet and adjusting the Actual and Target sheets accordingly.
Do I Need Advanced Excel Skills to Use This Dashboard?
No, the template is designed to be user-friendly.
Basic Excel knowledge like entering data and selecting dropdown options is enough.
How Can I Analyze Year-Over-Year Performance?
By using the Previous Year Number Sheet, you can compare current performance with the previous year and spot trends easily on the dashboard.
Click to Purchases Human Resources Customer Engagement KPI Dashboard in Excel
Visit our YouTube channel to learn step-by-step video tutorials