Managing human resources efficiently has become more important than ever. In today’s fast-paced work environment, HR departments must not only handle day-to-day tasks but also deliver excellent service to employees and management alike.
One of the smartest ways to monitor and improve HR service delivery is by using a Human Resources Service Delivery KPI Dashboard in Excel.
In this article, we’ll dive deep into what this dashboard is, why it’s important, how you can use it effectively, and the best practices for maximizing its impact. So, let’s jump right into it!
Click to Purchases Human Resources Service Delivery KPI Dashboard in Excel
What is a Human Resources Service Delivery KPI Dashboard?
A Human Resources Service Delivery KPI Dashboard is a centralized Excel-based tool that tracks and displays important metrics (KPIs) related to the performance of HR services.
These KPIs help HR teams measure how well they are handling tasks like recruitment, onboarding, training, employee satisfaction, issue resolution, and more.
Instead of juggling data across multiple sheets and reports, you get a single, dynamic view of all HR service delivery activities. This makes decision-making faster, more accurate, and more strategic.
Key Features of the Human Resources Service Delivery KPI Dashboard in Excel
We have carefully designed this ready-to-use dashboard to make your life easier. Here’s what you’ll find inside:
Home Sheet: Your Command Center

- An easy-to-navigate Home Sheet where six buttons allow you to jump directly to key sections.
- No more scrolling endlessly through multiple tabs. Just click and go!
Dashboard Sheet Tab: The Heart of the Dashboard
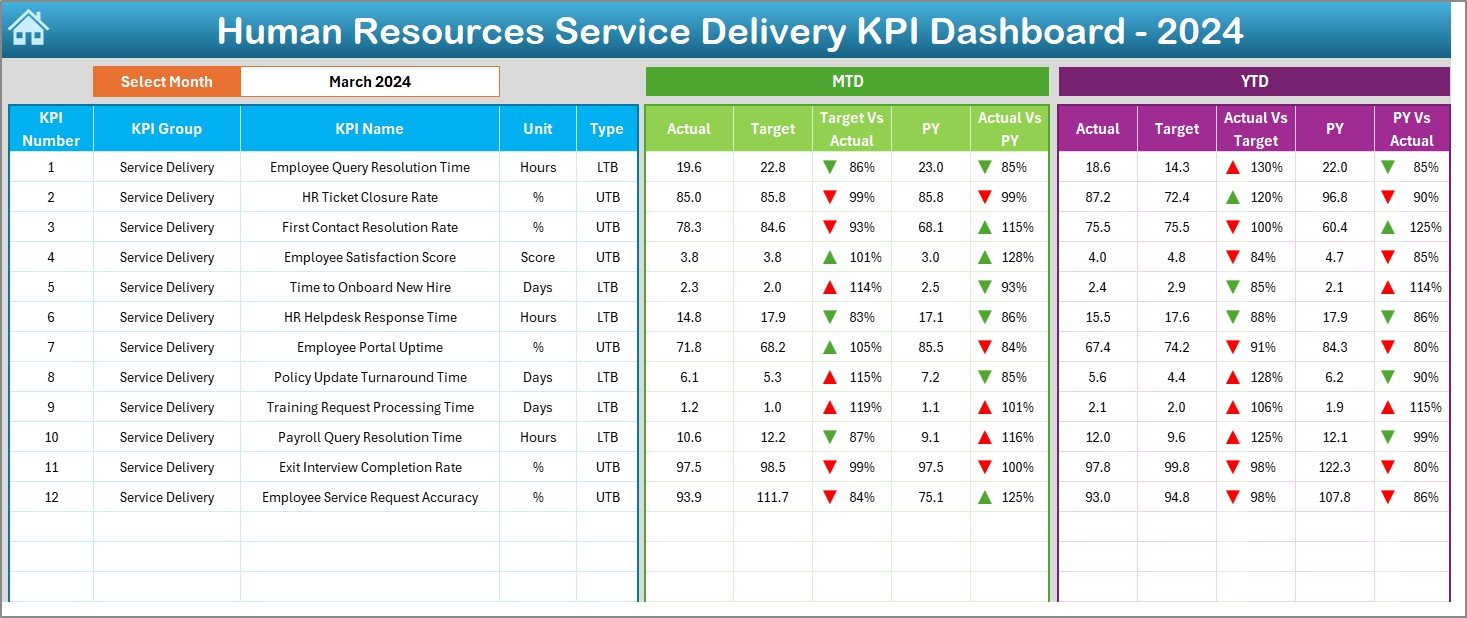
- View the overall performance at a glance.
- Select the Month from a drop-down in cell D3 to update the entire dashboard automatically.
- See the MTD (Month-to-Date) Actual, Target, and Previous Year numbers.
- Compare Target vs Actual and Previous Year vs Actual using up/down arrows for instant visual feedback.
- Understand YTD (Year-to-Date) performance with similar comparisons.
KPI Trend Sheet Tab: Dive into Trends

- Pick any KPI from a drop-down at cell C3.
- Instantly view the KPI Group, Unit, KPI Type (Lower the Better or Upper the Better), Formula, and Definition.
- Visualize the MTD and YTD trend charts for Actual, Target, and Previous Year values.
Actual Numbers Input Sheet: Keep it Real
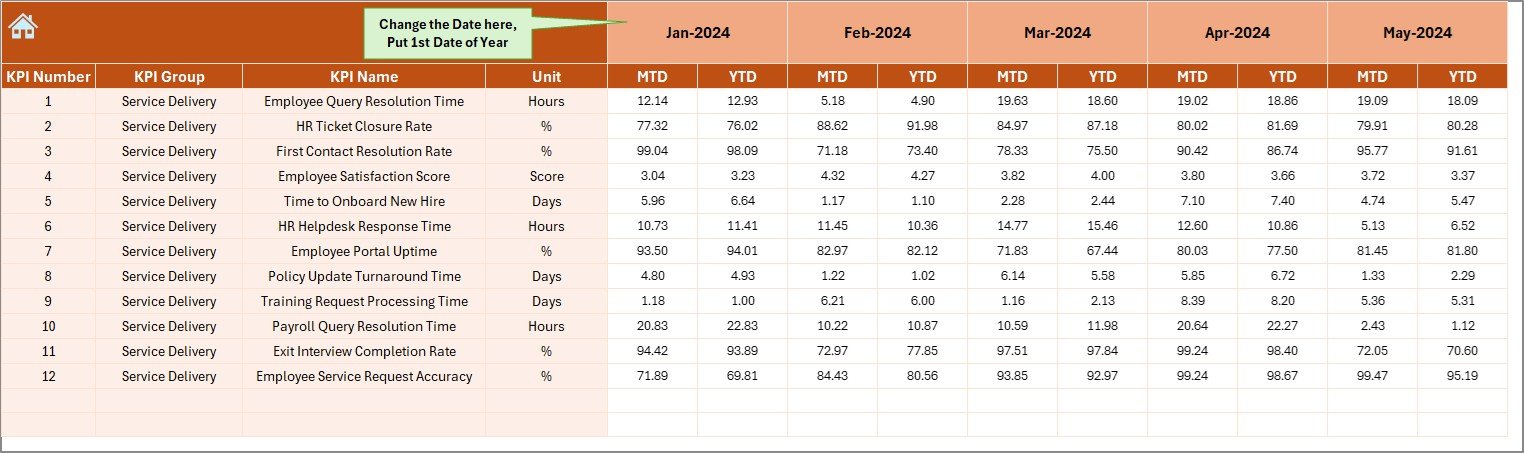
- Input your actual performance data here for every KPI, month-by-month.
- Just select the starting month in cell E1 and update the numbers.
Target Sheet Tab: Set the Benchmark

- Set your Target values for MTD and YTD for each KPI.
Previous Year Number Sheet Tab: Learn from History

- Enter the Previous Year’s numbers to enable direct and meaningful comparisons.
KPI Definition Sheet Tab: Know What You Measure

- Capture details like KPI Name, Group, Unit, Formula, and Definition so you always know what each KPI means.
Why is a Human Resources Service Delivery KPI Dashboard Important?
You may wonder, why do we even need a dashboard for HR service delivery? Let’s break it down:
- 🎯 Better Decision-Making: With all your important KPIs visible, you can make faster, smarter decisions.
- 📈 Improved Performance: Regular tracking ensures you meet your HR service goals.
- 📊 Increased Accountability: Everyone knows what is expected, leading to better ownership.
- ⏳ Time Saving: Instead of wasting hours compiling data, the dashboard brings everything to you.
- 🚀 Quick Trend Analysis: See issues early and take corrective actions immediately.
How to Use the Human Resources Service Delivery KPI Dashboard
Click to Purchases Human Resources Service Delivery KPI Dashboard in Excel
Using this dashboard is extremely easy. Here’s a simple step-by-step process:
Set the Starting Month:
Go to the Actual Numbers Input Sheet and update cell E1.
Fill in Actual Numbers:
Enter your monthly actual numbers for each KPI.
Define Targets:
On the Target Sheet, input your targets for MTD and YTD.
Add Previous Year Data:
Fill out the Previous Year Number Sheet for comparisons.
Monitor Performance:
Head to the Dashboard Sheet, select your month, and review your results.
Analyze Trends:
Go to the KPI Trend Sheet and check performance patterns over time.
That’s it! In just a few clicks, you’ll have a full performance snapshot.
Advantages of the Human Resources Service Delivery KPI Dashboard
Let’s explore some major benefits you can expect:
Centralized Data Management
No more searching across multiple files or folders. Everything you need is right here.
Instant Visibility into Performance
You can quickly see which areas are doing well and where improvement is needed.
Easy Comparisons
Compare Actual vs Target and Actual vs Previous Year with a single click.
Better Resource Allocation
Spot gaps in service delivery early, so you can allocate resources smartly.
Enhanced Employee Satisfaction
Faster and more reliable HR services mean happier employees.
Best Practices for Using the HR Service Delivery KPI Dashboard
Now that you know how powerful this tool is, let’s talk about how to use it like a pro:
Update Data Regularly
Make it a habit to input actual numbers every month without fail.
Review Targets Quarterly
Don’t just set targets once a year. Review and adjust them quarterly to stay realistic.
Conduct Trend Analysis Monthly
Use the trend charts every month to detect any hidden issues early.
Engage Your Team
Involve your HR team in reviewing the dashboard during monthly or quarterly meetings.
Keep KPIs Relevant
Ensure your KPIs reflect your business goals. Remove any outdated KPIs that no longer serve your objectives.
Use Conditional Formatting for Alerts
Color codes and arrows are your friends. They provide instant alerts about performance changes.
How to Customize the Human Resources Service Delivery KPI Dashboard
Although the dashboard is ready to use, you might want to tailor it a bit to suit your company’s unique needs. Here’s how:
- Add or Remove KPIs: Update the KPI Definition Sheet accordingly.
- Change Formatting: Modify conditional formatting rules to match your brand’s theme.
- Add More Visuals: Insert additional charts if you want deeper insights.
- Expand Data Entry Fields: If you want to track quarterly or weekly numbers, just insert columns.
Remember, Excel gives you full flexibility!
Common KPIs to Track in the Human Resources Service Delivery Dashboard
Wondering which KPIs you should include? Here’s a list of popular ones:
- Time to Hire
- Employee Satisfaction Score
- Training Completion Rate
- First-Call Resolution Rate (for HR queries)
- Employee Retention Rate
- Payroll Accuracy
- Onboarding Satisfaction Score
- Leave Application Turnaround Time
- HR Complaint Resolution Time
- Recruitment Cost per Hire
Choosing the right KPIs is crucial for making your dashboard truly valuable.
Why Choose Excel for Your HR Service Delivery Dashboard?
You might ask, why Excel? Why not a fancy tool? Here’s why:
- ✔️ Easy to Use
- ✔️ Highly Customizable
- ✔️ No Expensive Software Needed
- ✔️ Works Offline
- ✔️ Easily Shareable across teams
For most small to medium-sized businesses, Excel provides the perfect balance between functionality and affordability.
Conclusion
A Human Resources Service Delivery KPI Dashboard in Excel is not just a reporting tool—it’s a powerful weapon for HR efficiency and employee satisfaction.
It keeps your team aligned, your performance on track, and your data at your fingertips. With this dashboard, you no longer have to guess; you know exactly where you stand.
So, start using this dashboard today and transform the way your HR department delivers services!
Frequently Asked Questions (FAQs)
Q1. What KPIs are most important for HR Service Delivery?
Answer: Common KPIs include Time to Hire, Employee Retention Rate, Payroll Accuracy, Employee Satisfaction, and Training Completion Rate. These KPIs directly impact the quality and speed of HR services.
Q2. How often should I update the KPI Dashboard?
Answer: Ideally, you should update the dashboard monthly to track the MTD and YTD performance consistently. However, you can also update it weekly if you need more frequent insights.
Q3. Can I add new KPIs to the dashboard later?
Answer: Absolutely! You can add new KPIs by updating the KPI Definition Sheet, and then adjusting the input and target sheets accordingly.
Q4. Is Excel enough for a growing company’s HR needs?
Answer: For small to medium businesses, Excel works perfectly. As the company grows, you may later consider migrating to specialized HR software if needed.
Click to Purchases Human Resources Service Delivery KPI Dashboard in Excel
Visit our YouTube channel to learn step-by-step video tutorials