Managing import customs operations involves tracking complex data, deadlines, compliance rules, and performance metrics. To simplify and streamline this process, we present the Import Customs KPI Dashboard in Excel. This tool is a ready-to-use, interactive Excel-based template designed to help customs teams, logistics managers, and supply chain analysts monitor and improve performance.
In this guide, you’ll learn everything you need to know about using and benefiting from this dashboard. Let’s dive into the features, advantages, best practices, and frequently asked questions.
Click to Import Customs KPI
What Is the Import Customs KPI Dashboard in Excel?
The Import Customs KPI Dashboard in Excel is a pre-built template that helps you track Key Performance Indicators (KPIs) related to import customs processes. It provides a detailed monthly and yearly view of your actual performance versus targets and previous year data, all in a visually rich and interactive layout.
This tool includes:
- Monthly tracking of actuals, targets, and last year’s figures
- Conditional formatting to highlight trends
- Trend analysis through graphs and charts
- A clean and user-friendly interface
Why Should You Use a KPI Dashboard for Import Customs?
Monitoring performance manually can lead to errors, delays, and missed opportunities. An Excel dashboard solves these problems efficiently.
Key Benefits:
✅ Centralized Data – Store and manage all import-related KPIs in one file
✅ Quick Insights – Visual dashboards simplify decision-making
✅ Customizable – Easily update and tailor the KPIs as needed
✅ Time-Saving – Automatic calculations and dynamic filters reduce manual work
✅ Error-Free Reporting – Built-in formulas ensure accurate results
Explore the 7 Worksheets Inside the Dashboard
Let’s take a closer look at each of the seven tabs that make this dashboard so powerful.
Home Sheet
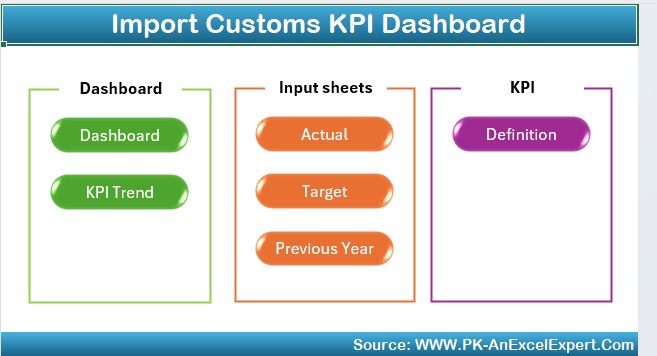
This is your entry point to the dashboard. It works as an index sheet, offering six navigation buttons to jump directly to the respective sheets.
Features:
- Clean interface
- Easy navigation
- Quick access to different sections
Click to Import Customs KPI
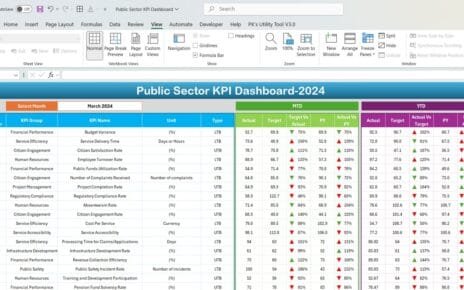
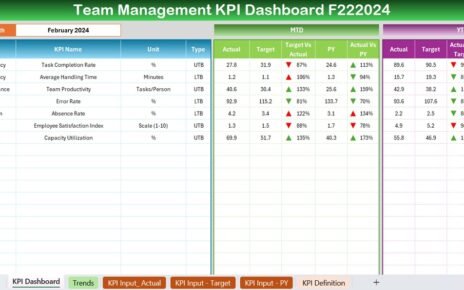
Dashboard Sheet Tab
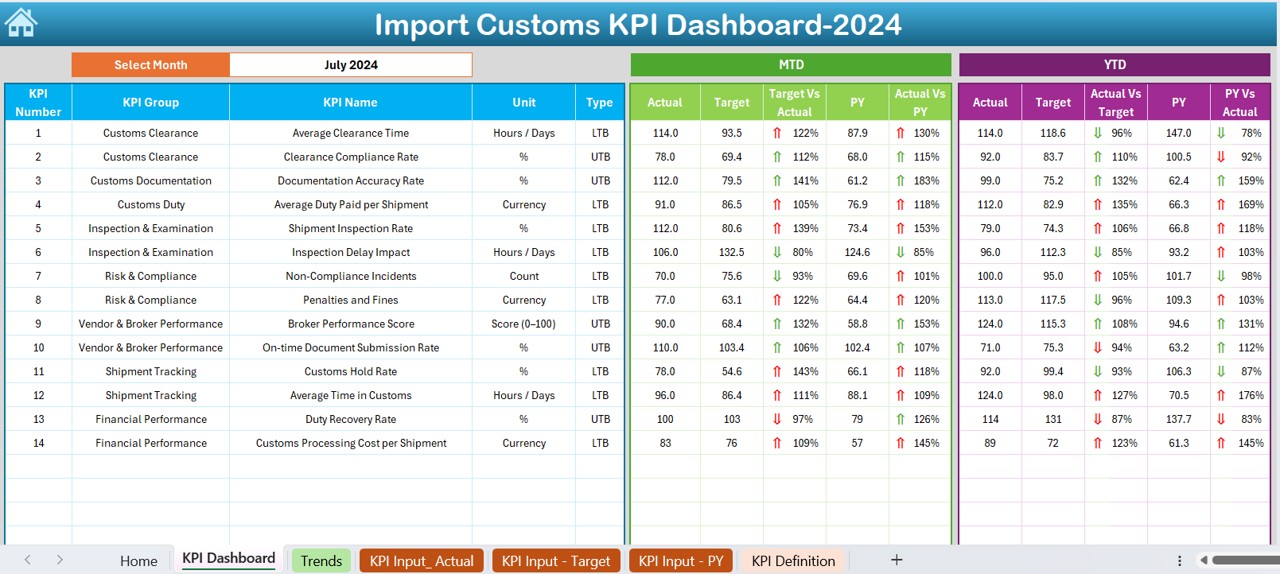
- This is the heart of the template. The dashboard sheet displays:
- Month selector (dropdown on cell D3)
- MTD (Month-to-Date) Actual, Target, Previous Year
- YTD (Year-to-Date) Actual, Target, Previous Year
- Conditional formatting with up/down arrows for Target vs. Actual and PY vs. Actual
Dynamic Data:
- Change the month, and the entire dashboard updates instantly.
Visual Insights:
- Charts and color indicators help you understand performance at a glance.
KPI Trend Sheet Tab
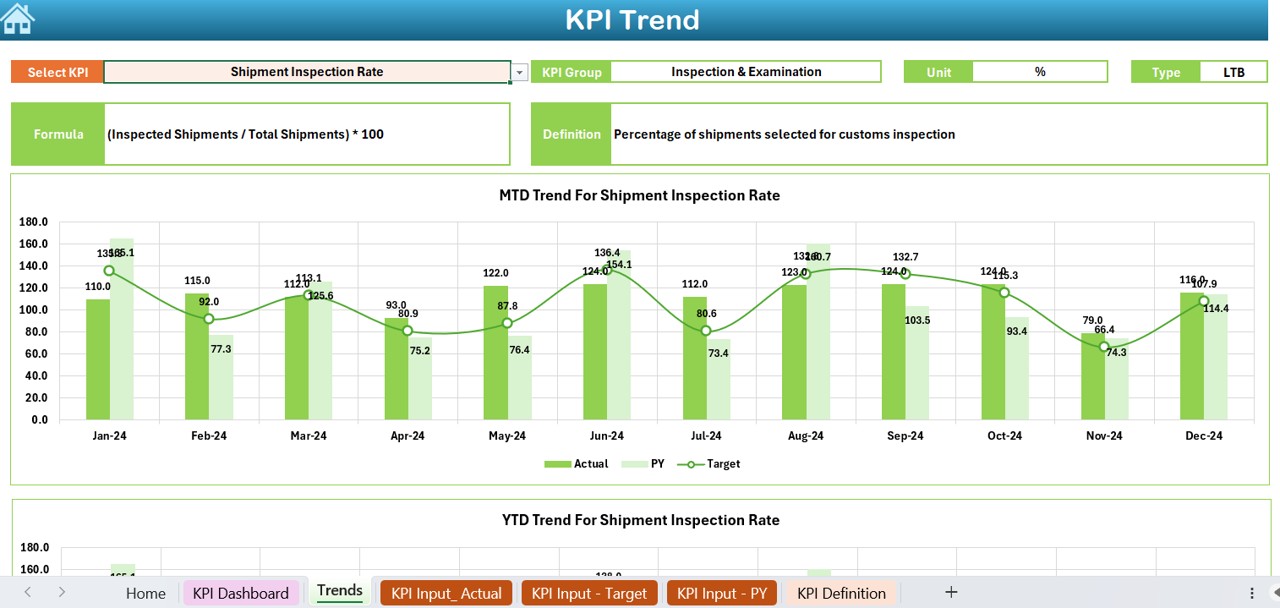
This sheet allows you to analyze trends across time.
How it works:
- Select a KPI from a dropdown in cell C3
- View details like KPI Group, Unit, Type (Lower is better or Upper is better), Formula, and Definition
- See charts for MTD and YTD trends including Actual, Target, and Previous Year
- This sheet gives you a deeper view into how each KPI is performing over time.
Actual Numbers Input Sheet
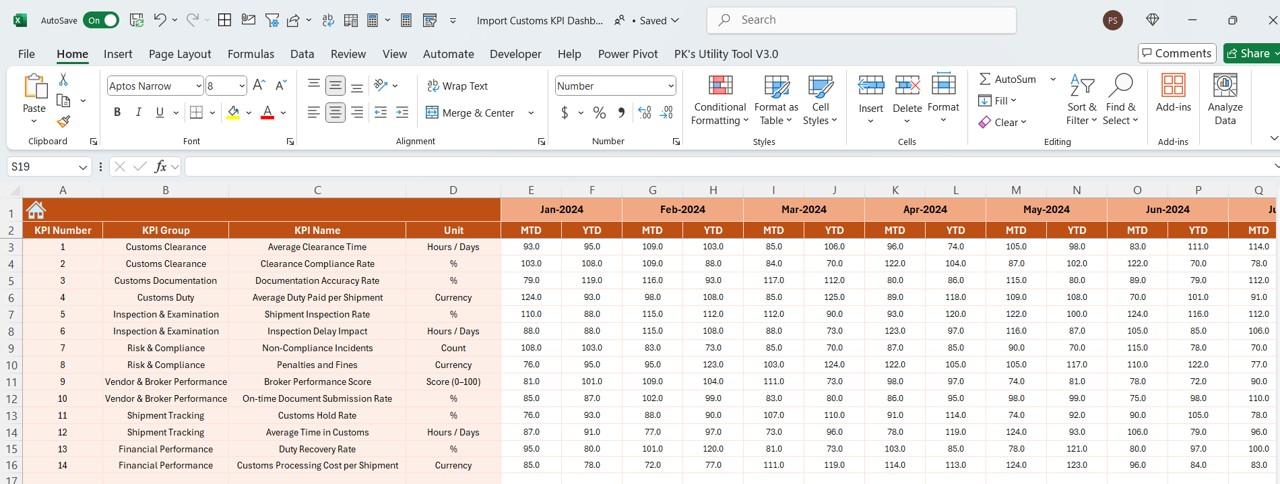
In this sheet, you enter your monthly actual performance.
Steps to Use:
- Select the start month from cell E1
- Enter MTD and YTD values for each KPI
- This input drives the dashboard calculations.
Click to Import Customs KPI
Target Sheet Tab
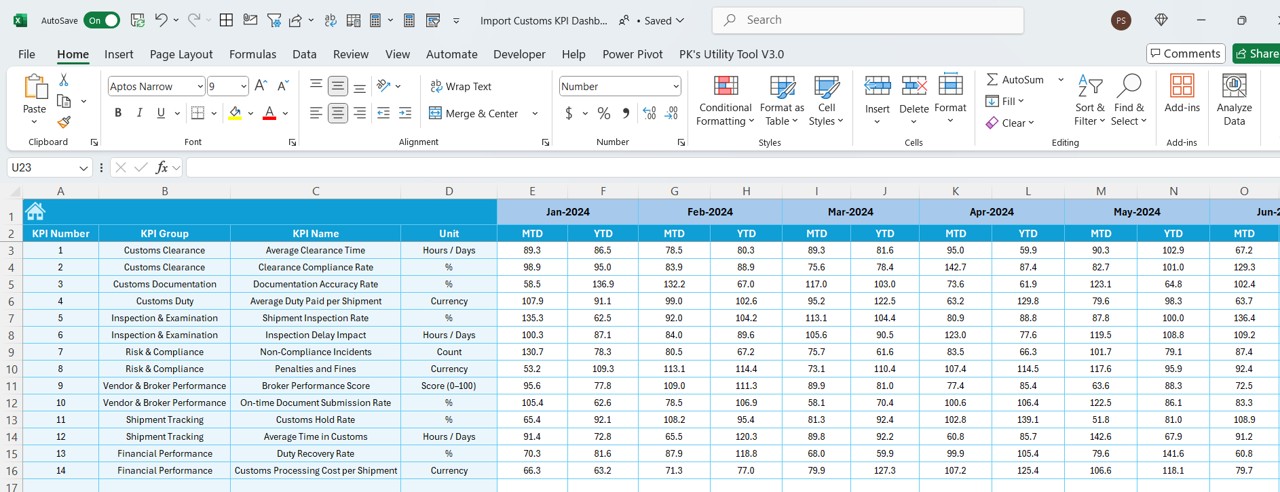
You’ll use this sheet to set performance goals.
Instructions:
- Define monthly MTD and YTD targets for each KPI
- Use historical data or strategic benchmarks to set goals
Previous Year Number Sheet Tab
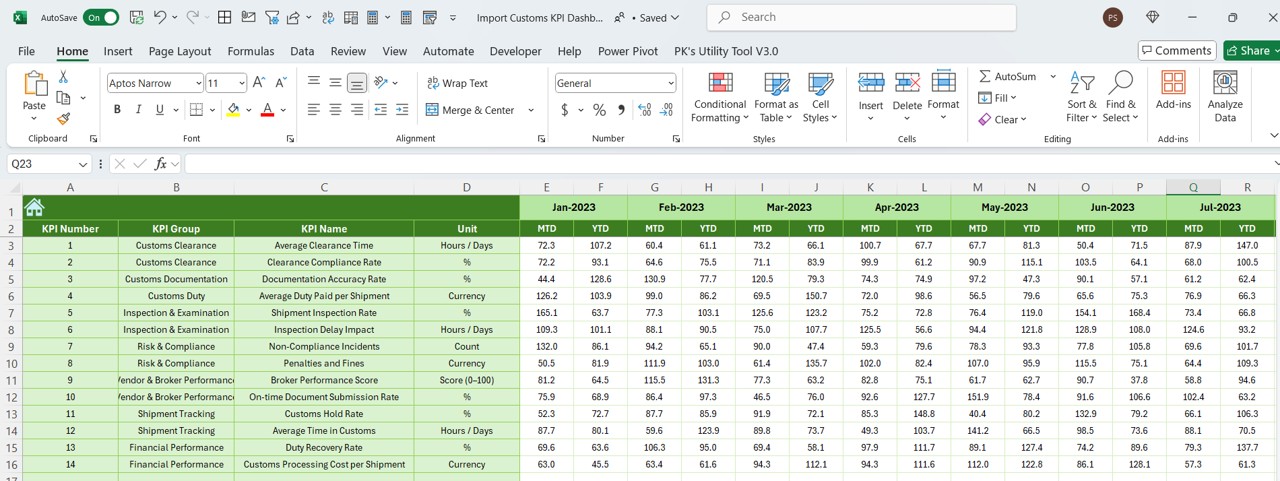
This sheet stores your past year’s performance numbers.
Why it’s useful:
- Allows comparison of current vs. previous year
- Enables trend analysis and seasonal benchmarking
KPI Definition Sheet Tab
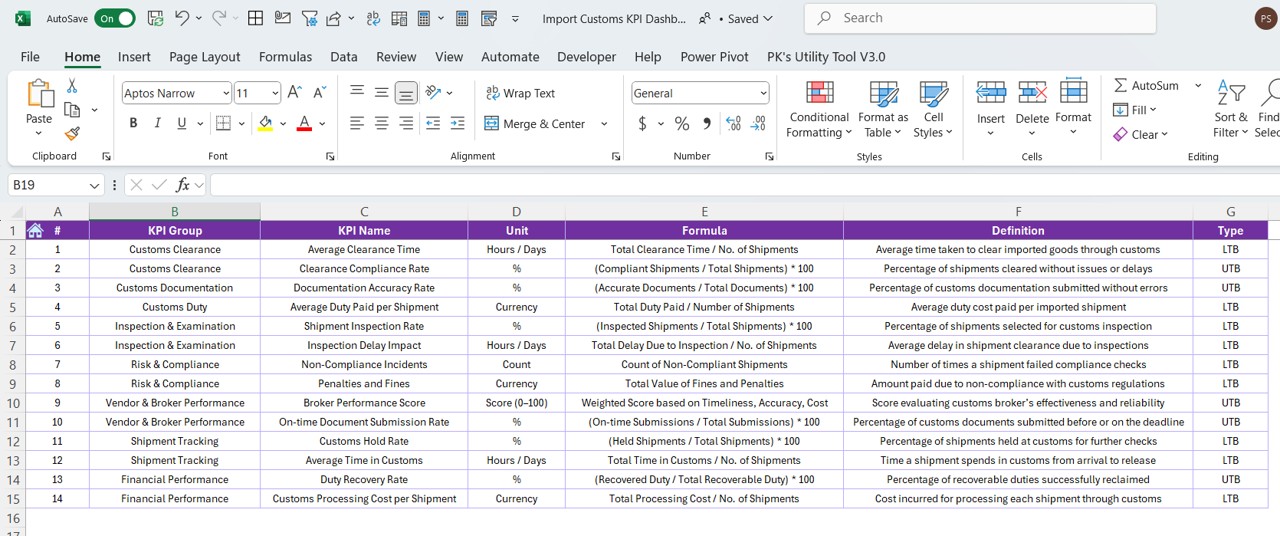
Here, you document each KPI.
Click to Import Customs KPI
What to Enter:
- KPI Name
- KPI Group
- Unit of measurement
- Formula used
- Short definition
Best Practices for Using the Dashboard
Follow these tips to get the most out of your Import Customs KPI Dashboard:
- Keep Your Data Updated: Update the “Actual Numbers” and “Target” sheets regularly, ideally every month.
- Define Your KPIs Clearly: Use the KPI Definition sheet to explain what each KPI means, how it’s calculated, and whether lower or higher values are better.
- Compare with Past Data: Enter last year’s numbers to evaluate year-over-year performance.
- Review Monthly Trends: Use the KPI Trend sheet to identify patterns and seasonal variations.
- Set Realistic Targets: Set achievable, data-based goals using the Target sheet.
- Validate Your Inputs: Ensure the data you enter is accurate to avoid misleading visuals.
- Backup Your File: Always keep a backup copy before making significant changes.
How to Customize the Dashboard
This dashboard is flexible enough for any organization. Here’s how you can personalize it:
- Add new KPI rows in all relevant sheets
- Adjust formulas as per your metrics
- Change colors or branding to match your organization
- Add new months or years as you scale
Conclusion
The Import Customs KPI Dashboard in Excel offers an efficient and powerful way to manage and monitor customs performance. With interactive charts, trend analysis, and easy data input, it makes KPI tracking effortless for import teams.
Start using it today and experience a new level of clarity in your operations.
Frequently Asked Questions (FAQs)
Can I use this dashboard without advanced Excel knowledge?
Yes! The dashboard is designed to be user-friendly. You only need to enter data and select months using dropdowns. All calculations and visuals update automatically.
Can I track different KPIs than the ones listed?
Absolutely. You can replace or add new KPIs in all relevant sheets—just ensure that you follow the same structure.
What if I need to track weekly instead of monthly data?
You can modify the data structure to support weekly tracking. However, that may require more adjustments in the layout and formulas.
Is the dashboard suitable for large organizations?
Yes. It’s scalable and can handle large volumes of data. You can also enhance it by integrating with Power BI or other tools if needed.
Can I use this dashboard for export customs instead?
Yes. With slight modifications in KPI definitions and data input, the dashboard can be adapted for export customs as well.
Click to Import Customs KPI
Visit our YouTube channel to learn step-by-step video tutorials