An income dashboard in Excel is a powerful tool that helps you track and analyze your income sources and financial health. This ready-to-use template can be utilized for both personal and office use, offering a clear and organized view of your financial data.
Key Features
The income dashboard template consists of four main worksheets:
- Dashboard Sheet Tab
- Data Sheet Tab
- List Sheet Tab
- Support Sheet Tab
Dashboard Sheet Tab
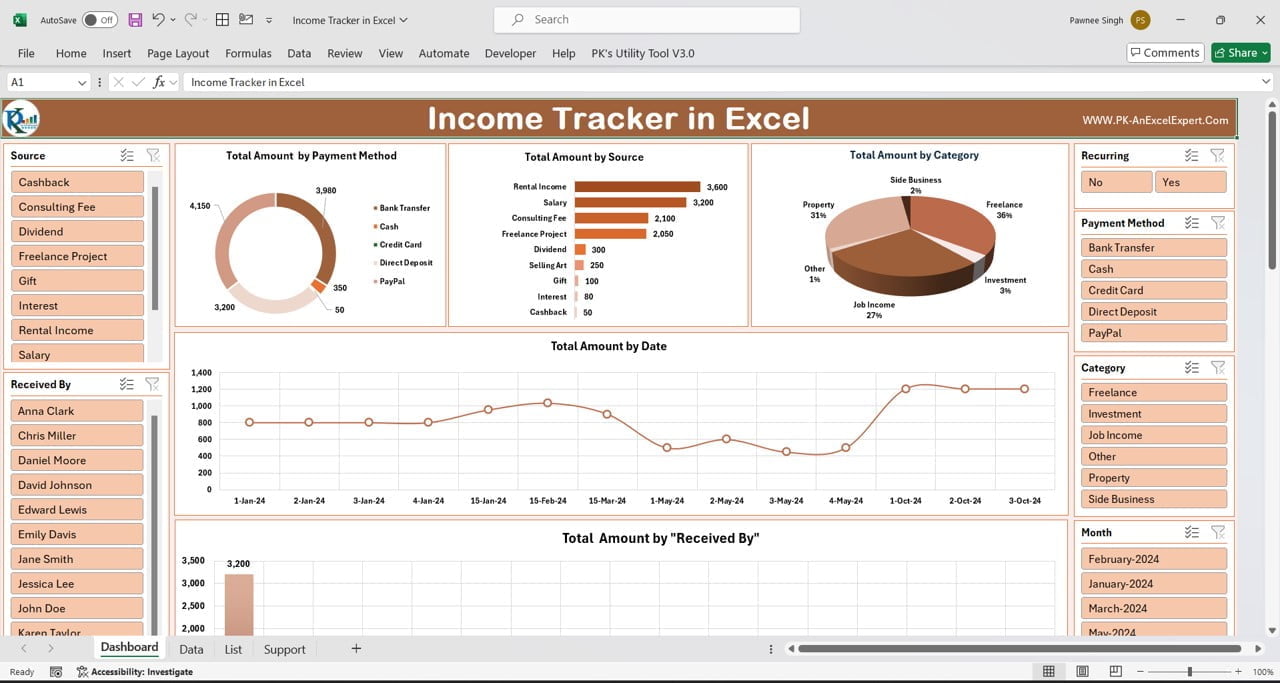
The Dashboard Sheet is the heart of the income dashboard, featuring multiple charts and slicers for easy data visualization and filtering.
Click to buy Income Dashboard in Excel
In this dashboard sheet tab we have below given charts and visualizations:
Top Section Charts:
- Total Amount by Payment Method: This doughnut chart displays the total amount of income by various payment methods such as Bank Transfer, Cash, Credit Deposit, PayPal, etc.
- Total Amount by Source: A bar chart that visualizes the total income by source, including Rental Income, Salary, Consulting Fees, Freelance Projects, Dividends, Selling Art, Gifts, Interest, and Cashback.
- Total Amount by Category: This 3D pie chart shows the total income by category, highlighting Property, Side Business, Freelancer, Investment, Job Income, etc.
Middle Section:
Total Amount by Date: This is a line chart. We are showing here income trends by date.
Bottom Section:
Total Amount by Received By: A column chart that presents the total income by the recipient, offering insights into who receives the most payments.
Slicers:
The dashboard includes slicers for Source, Received By, Recurring, Payment Method, Category, and Month, allowing for easy filtering and data analysis.
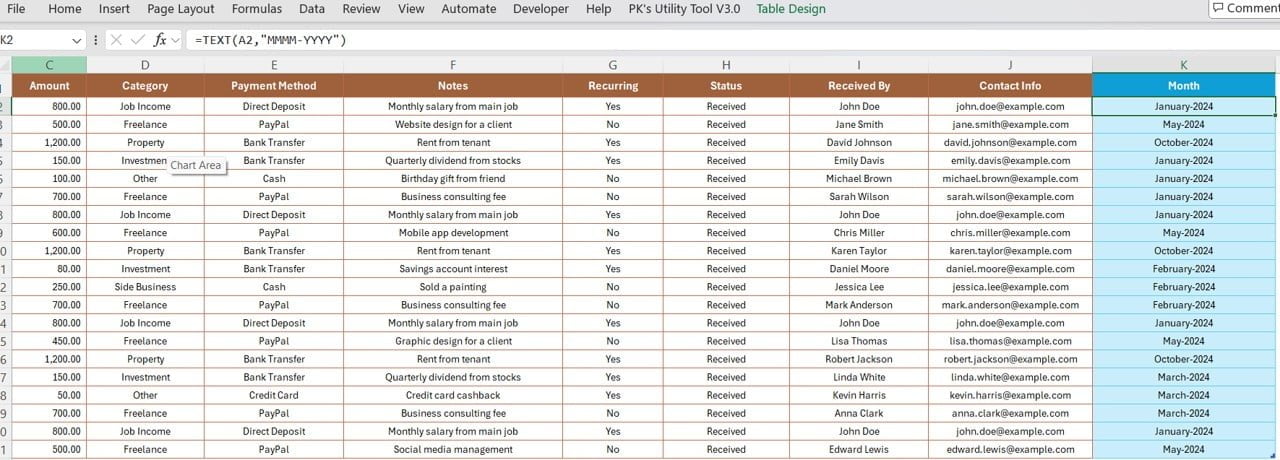
Data Sheet Tab
The Data Sheet Tab is where you enter your transaction data. The columns include:
Click to buy Income Dashboard in Excel
- Date: Enter the transaction date.
- Source: Select the income source from a dropdown list.
- Amount: Enter the income amount.
- Category: Select the income category from a dropdown list.
- Payment Method: Choose the payment method from the dropdown list.
- Notes: Add any relevant notes.
- Recurring: Indicate whether the income is recurring (Yes/No).
- Status: Enter the income status as received.
- Received By: Specify who received the payment.
- Contact Info: Provide the email address of the payer.
- Month: This is a formula field. You don’t need to enter anything here.
List Sheet Tab
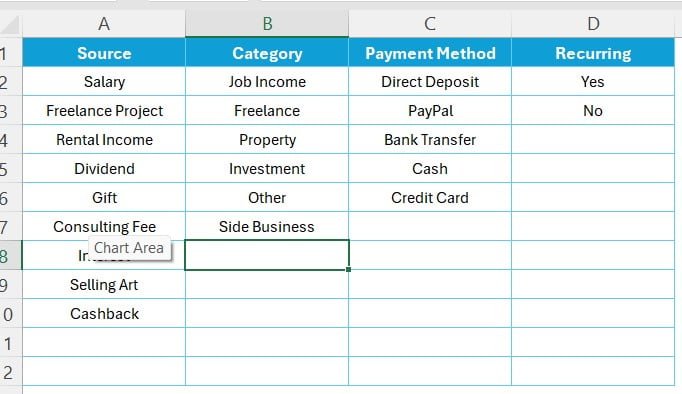
Click to buy Income Dashboard in Excel
This sheet contains four columns: Source, Category, Payment Method, and Recurring. These columns are used to populate the dropdown lists in the Data Sheet Tab.
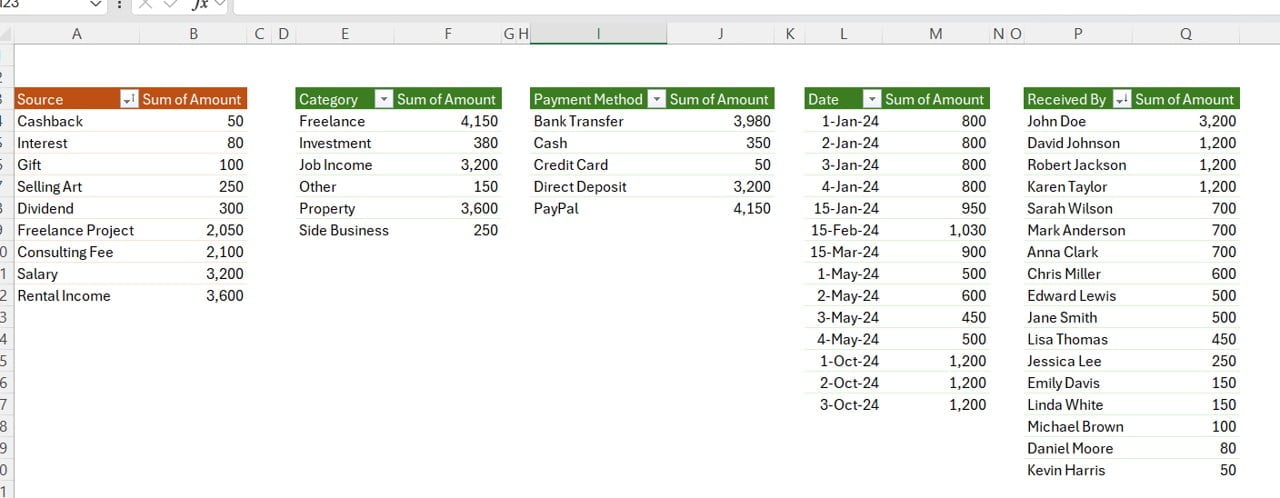
Support Sheet Tab
The Support Sheet is a hidden tab where we have created the multiple pivot tables. These pivot tables are connected to the dashboard sheet tab.
Click to buy Income Dashboard in Excel
Advantages of Using an Income Dashboard in Excel
Using an income dashboard in Excel offers numerous benefits:
- Centralized Data Management: All your income data is stored in one place, making it easy to track and manage.
- Visual Insights: The dashboard provides visual representations of your income data, helping you to quickly understand your financial situation.
- Customizable: The template can be customized to fit your specific needs, allowing you to add or modify charts and data fields.
- Improved Financial Planning: By having a clear view of your income sources and amounts, you can make more informed financial decisions and plan for the future.
- Time-Saving: Automated calculations and visualizations save time and reduce the likelihood of errors.
Opportunity for Improvement in Income Dashboards
While the income dashboard in Excel is a powerful tool, there are always opportunities for improvement:
- Enhanced Automation: Integrating more automation, such as automatically importing data from bank statements or other financial tools, could save even more time.
- Advanced Analytics: Adding more advanced analytics features, such as predictive analysis or trend forecasting, could provide deeper insights into your financial data.
- Mobile Accessibility: Ensuring the dashboard is mobile-friendly or creating a dedicated mobile app could make it easier to track income on the go.
- User Interface Improvements: Simplifying the user interface and making it more intuitive could enhance the user experience, making it easier for non-technical users to navigate and use the dashboard.
- Integration with Other Tools: Integrating the dashboard with other financial tools or software could create a more comprehensive financial management system.
Best Practices for Using the Income Dashboard
To get the most out of your income dashboard, follow these best practices:
- Regular Data Entry: Consistently enter your income data to ensure the dashboard remains up-to-date and accurate.
- Utilize Slicers: Use the slicers to filter and analyze your data from different perspectives, such as by source, category, or payment method.
- Review Charts Periodically: Regularly review the charts to identify trends, patterns, and anomalies in your income.
- Keep Backup Copies: Maintain backup copies of your dashboard to prevent data loss and ensure you have a reference point if needed.
- Customize to Your Needs: Tailor the dashboard to your specific requirements, adding or modifying fields and charts as necessary to better suit your financial tracking needs.
Frequently Asked Questions (FAQs)
Q. What is an income dashboard in Excel?
A. An income dashboard in Excel is a tool that helps you track, manage, and analyze your income sources and amounts using visual charts and data tables.
Q2. How do I use the income dashboard template?
A. To use the template, enter your income data in the Data Sheet Tab, and the dashboard will automatically update with visual charts and insights based on the data you input.
Q3. Can I customize the income dashboard template?
A. Yes, the template is fully customizable. You can add or modify charts, data fields, and other elements to fit your specific needs.
Q4. What are the benefits of using an income dashboard?
A. The benefits include centralized data management, visual insights, improved financial planning, time-saving automation, and the ability to make more informed financial decisions.
Q5. How often should I update my income dashboard?
A. It’s best to update your income dashboard regularly, ideally whenever you receive new income or at least monthly, to ensure it remains accurate and up-to-date.
Q6. Can I use the income dashboard for business purposes?
A. Yes, the income dashboard can be used for both personal and business purposes to track and manage income from various sources.
By following these guidelines and utilizing the provided information, you can effectively create and use an income dashboard in Excel to manage your financial data efficiently and accurately.
Click to buy Income Dashboard in Excel
Visit our YouTube channel to learn step-by-step video tutorials
Watch the step-by-step video tutorial:
Click to buy Income Dashboard in Excel