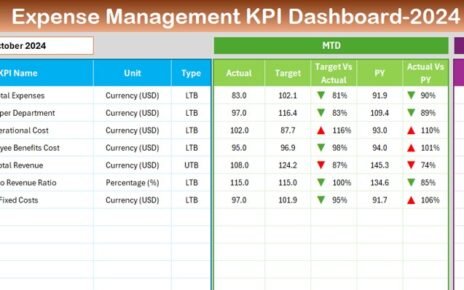
In today’s digital age, influencer marketing has become a cornerstone strategy for brands looking to expand their reach and engagement. To effectively measure and manage these efforts, an Influencer Marketing KPI Dashboard in Excel provides an indispensable tool. This article delves into how to set up and utilize such a dashboard, ensuring you can track performance and optimize your marketing strategies efficiently.
Click to Influencer Marketing KPI
Introduction to the Influencer Marketing KPI Dashboard
An Influencer Marketing KPI Dashboard in Excel is a sophisticated tool designed to monitor and analyze the performance of your influencer campaigns. By integrating various Key Performance Indicators (KPIs), this dashboard allows marketers to gauge the efficacy of their strategies and make data-driven decisions.
Key Features of the Influencer Marketing KPI Dashboard
- The dashboard comprises seven detailed worksheets, each tailored to specific data management and analysis needs:
Home Sheet

Click to Influencer Marketing KPI
- Acts as the central navigation hub with buttons linking to each of the other six sheets, facilitating easy access and usability.
Dashboard Sheet Tab

- Displays comprehensive data across all KPIs, with dynamic filtering by month using a dropdown menu. It includes:
- Month-to-Date (MTD) Actuals vs. Targets, and Previous Year comparisons
- Year-to-Date (YTD) data comparisons
- Conditional formatting highlights deviations, trends, and insights at a glance.
Click to Influencer Marketing KPI
KPI Trend Sheet Tab

- Offers a dropdown to select individual KPIs, showing their group, unit, type (e.g., “Lower the Better” or “Upper the Better”), formula, and definition.
- Visual trend charts for MTD and YTD provide a historical performance overview.
Actual Numbers Input Sheet

- Here, you input actual MTD and YTD figures for each month. The sheet is designed for easy month-to-month transitions.
Target Sheet Tab

- Enter target figures for each KPI, for both MTD and YTD, facilitating target versus performance analysis.
Previous Year Number Sheet Tab

- Record the previous year’s data to compare current year performance against past metrics.
KPI Definition Sheet Tab

- Define each KPI with its name, group, unit, formula, and detailed description, ensuring clarity across teams.
Advantages of Using an Influencer Marketing KPI Dashboard
Using an Excel-based dashboard to track influencer marketing efforts brings several advantages:
- Centralized Data Management: Consolidate all your data in one place, making it easier to monitor and analyze.
- Real-Time Updates: Modify and update data in real-time to reflect the most current insights.
- Customizability: Tailor your dashboard to focus on KPIs that are most relevant to your specific marketing goals.
- Cost-Effective: Leverage Excel, a tool you likely already have, avoiding the need for additional costly software.
Best Practices for Maintaining Your Influencer Marketing KPI Dashboard
- To get the most out of your KPI dashboard, consider the following best practices:
- Regularly update the dashboard to ensure data freshness and relevance.
- Use clear and concise KPI definitions to ensure uniform understanding across all stakeholders.
- Engage with the data interactively by exploring different scenarios and their impacts on KPIs.
- Train your team on how to use the dashboard effectively, ensuring everyone can extract and interpret the data correctly.
Conclusion
The Influencer Marketing KPI Dashboard in Excel is a powerful tool for any digital marketer. It not only simplifies data analysis and improves decision-making but also enhances the strategic planning of influencer campaigns. By implementing this dashboard, you can ensure that your influencer marketing efforts are both measurable and scalable.
Frequently Asked Questions
Q. What is a KPI Dashboard?
A KPI Dashboard is a visual representation tool that displays the most important indicators of performance effectively to allow informed decisions.
Q. How often should I update my Influencer Marketing KPI Dashboard?
Ideally, update your dashboard as new data comes in or at least monthly to keep all stakeholders informed of the latest trends and figures.
Q. Can I customize this dashboard to fit my specific needs?
Absolutely! This dashboard is fully customizable. You can add or modify the existing KPIs and visuals to better suit your campaign’s objectives.
Click to Influencer Marketing KPI
Visit our YouTube channel to learn step-by-step video tutorials
View this post on Instagram


