In today’s digital age, influencer marketing has become a critical component of brand promotion strategies. Businesses across industries are leveraging influencers to increase their reach and brand awareness. But how do you measure the effectiveness of these campaigns? The answer lies in creating an Influencer ROI KPI Dashboard in Excel.
An Influencer ROI (Return on Investment) KPI Dashboard provides a centralized view of how well an influencer campaign is performing. With KPIs like engagement rates, conversion rates, and cost-per-click (CPC), businesses can assess the true value influencers bring to the table. In this article, we will explore how to create a detailed and efficient Influencer ROI KPI Dashboard in Excel, providing you with key metrics, formulas, and best practices to ensure that your influencer marketing efforts are both measurable and profitable.
What is an Influencer ROI KPI Dashboard?
An Influencer ROI KPI Dashboard is a powerful tool that aggregates various Key Performance Indicators (KPIs) related to influencer marketing campaigns. By tracking these metrics, businesses can determine if their influencer marketing efforts are delivering a positive return on investment (ROI). These KPIs help measure both the financial and non-financial impact of the campaign, providing insight into which influencers are delivering the most value.
Key Features of the Influencer ROI KPI Dashboard
The Influencer ROI KPI Dashboard in Excel is designed to track important metrics in real-time. The dashboard includes multiple worksheets that work together to display comprehensive data about influencer performance. Let’s break down the key features:
1. Home Sheet Tab: The Starting Point
The Home Sheet Tab serves as the central hub for your dashboard. It provides a quick overview of all your KPIs and allows you to navigate easily between different tabs. This tab should have the following features:
-
Click-to-jump links: These links will help you easily navigate to different sections of the dashboard, like the KPI definitions or data input sheets.
-
Quick summary: Display summary cards showcasing key KPIs, like total sales, engagement rates, and ROI.
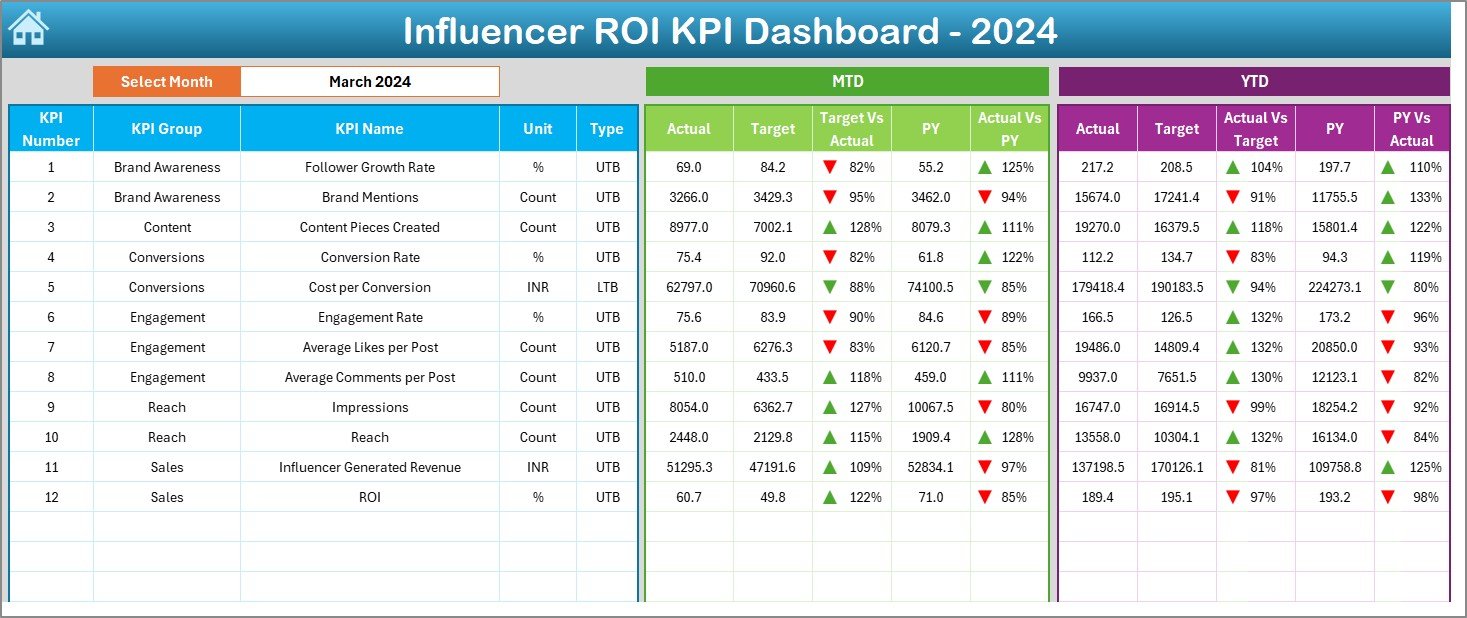
2. Dashboard Sheet Tab: Visualizing the KPIs
The Dashboard Sheet Tab is the heart of the Influencer ROI KPI Dashboard. Here, you will see various charts and graphs that visualize the performance of your influencer campaigns. The dashboard features the following:
-
MTD (Month-To-Date) and YTD (Year-To-Date) data: These metrics show the actual figures for the current month and the year, respectively.
-
Target vs. Actual comparison: Visual comparisons between the actual data and your set targets.
-
Previous Year Comparison: This metric helps you analyze the growth or decline in performance by comparing this year’s data to the previous year.
-
Conditional Formatting: Use color-coding and arrows (up or down) to easily spot positive or negative trends in your data.
Click to buy Influencer ROI KPI Dashboard in Excel
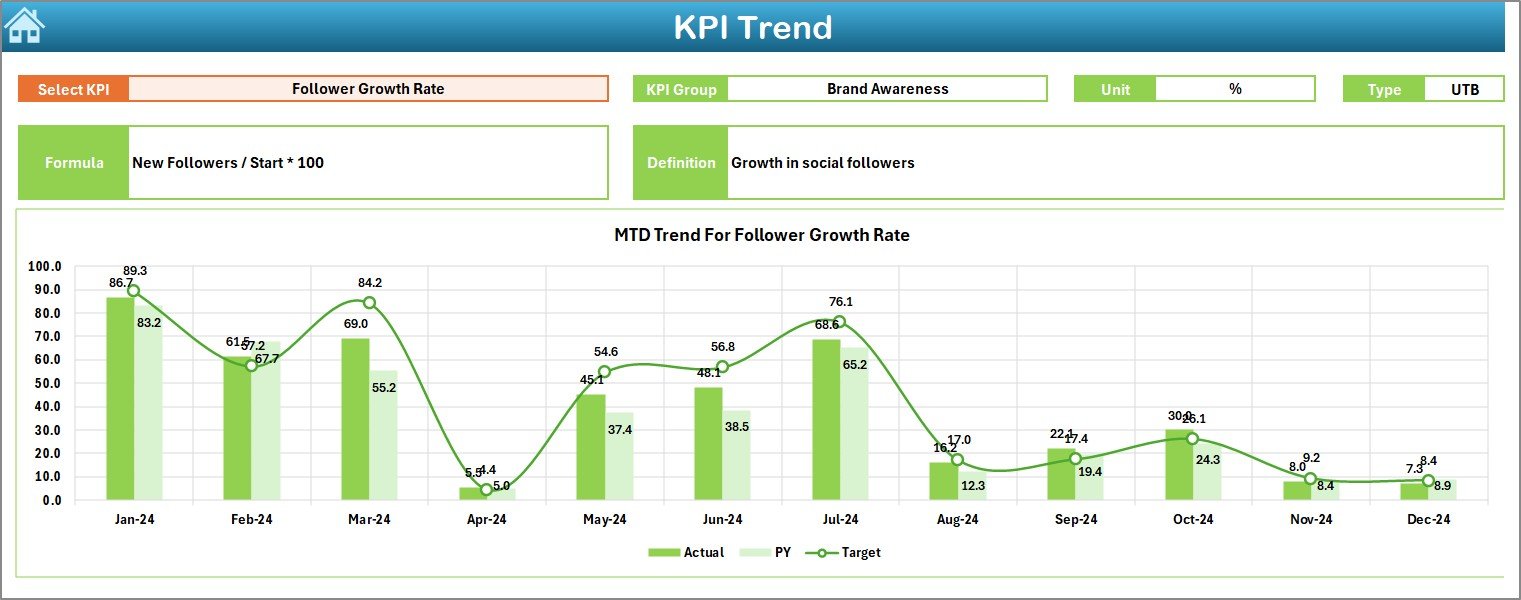
3. KPI Trend Sheet Tab: Tracking KPI Performance Over Time
The KPI Trend Sheet Tab allows you to track the performance of individual KPIs over time. You can select the KPI name from a dropdown menu, and the sheet will display the following:
-
KPI Group: The category under which the KPI falls (e.g., Engagement, Conversion, etc.).
-
Unit of Measurement: The unit in which the KPI is measured (e.g., percentage, number of clicks).
-
KPI Type: Whether the KPI is “Upper the better” (higher is better) or “Lower the better” (lower is better).
-
Formula and Definition: The formula used to calculate the KPI and a brief definition.
4. Actual Number Sheet Tab: Inputting Real Data
In the Actual Number Sheet Tab, you will enter the actual figures for both YTD and MTD data. The dashboard will automatically update based on the information you input. Features include:
-
Data input fields for each KPI, such as actual influencer engagement, conversions, and total cost.
-
Dropdown to select the month: Adjust the data for any specific month to track how influencer performance fluctuates over time.

Click to buy Influencer ROI KPI Dashboard in Excel
5. Target Sheet Tab: Setting the Benchmarks
The Target Sheet Tab allows you to enter your target numbers for each KPI. By comparing these targets with the actual results, you can quickly assess whether your influencer campaigns are meeting expectations.
-
MTD and YTD target fields: Set targets for each KPI for both the current month and the entire year.

6. Previous Year Number Sheet Tab: Benchmarking Against the Past
In the Previous Year Number Sheet Tab, input last year’s data for each KPI. This will allow you to compare the current year’s performance with historical data and identify any significant growth or declines.
-
Enter the same data you did for the current year in this tab to ensure accurate comparisons.

Click to buy Influencer ROI KPI Dashboard in Excel
7. KPI Definition Sheet Tab: Understanding the KPIs
The KPI Definition Sheet Tab provides a comprehensive list of all the KPIs being tracked in the dashboard. It includes:
-
KPI Name
-
KPI Group
-
Unit
-
Formula: The mathematical formula used to calculate the KPI.
-
Definition: A short explanation of what each KPI measures.

Advantages of Using an Influencer ROI KPI Dashboard
-
Real-Time Insights: The dashboard allows you to track the success of your influencer campaigns in real-time, giving you immediate insights into performance.
-
Data-Driven Decisions: By using KPIs, businesses can make informed decisions about which influencers are bringing the most value.
-
Improved Budget Allocation: Knowing which influencers provide the best ROI helps you allocate your marketing budget more efficiently.
-
Better Campaign Optimization: Regular monitoring of KPIs lets you identify underperforming areas, allowing for campaign adjustments.
Opportunities to Improve the Influencer ROI KPI Dashboard
-
Integrating More Data Sources: To improve the accuracy and depth of analysis, consider integrating external data sources such as social media platforms and CRM tools.
-
Incorporating Predictive Analytics: Adding predictive analytics to forecast the future performance of influencer campaigns can give a competitive edge.
-
Customizing Visualizations: Customize charts and graphs for specific goals or departments to improve user experience.
-
Automating Data Input: Use automation tools to input data from social media platforms to save time and reduce errors.
Best Practices for Creating an Influencer ROI KPI Dashboard
Click to buy Influencer ROI KPI Dashboard in Excel
-
Choose the Right KPIs: Focus on KPIs that directly measure the effectiveness of your influencer campaigns, such as engagement rate and ROI.
-
Keep It Simple: Avoid overcrowding the dashboard with too many metrics. Focus on the most impactful KPIs.
-
Regularly Update Data: Ensure that the data in the dashboard is updated regularly to maintain accuracy.
-
Use Conditional Formatting: Use color codes and arrows to make trends easy to spot and understand.
-
Make It User-Friendly: Design the dashboard to be intuitive and accessible for all team members.
Conclusion
Creating an Influencer ROI KPI Dashboard in Excel allows businesses to measure the success of influencer marketing campaigns effectively. By tracking key performance indicators like engagement rates, conversion rates, and ROI, businesses can assess the value influencers bring and optimize future campaigns. With the right KPIs, formulas, and data input, this dashboard serves as a vital tool for data-driven decision-making in influencer marketing.
Frequently Asked Questions (FAQ)
1. What is the purpose of an Influencer ROI KPI Dashboard?
The purpose of an Influencer ROI KPI Dashboard is to track and measure the performance of influencer marketing campaigns. It helps businesses assess whether their influencer efforts are delivering a positive return on investment.
2. What KPIs should be included in the Influencer ROI KPI Dashboard?
Key KPIs include engagement rate, conversion rate, cost per acquisition (CPA), ROI, cost per click (CPC), influencer reach, and impressions.
3. How often should I update the Influencer ROI KPI Dashboard?
It’s recommended to update the dashboard regularly, at least monthly, to track performance in real-time and make necessary adjustments.
4. Can I customize the Influencer ROI KPI Dashboard?
Yes, the dashboard is fully customizable. You can adjust KPIs, add new metrics, or modify the visualizations based on your business needs.
Visit our YouTube channel to learn step-by-step video tutorials