Interior design is a dynamic and creative field where success hinges on meeting client expectations, maintaining budgets, and ensuring projects are completed on time. Just as in any other business, it’s essential to measure performance, track progress, and assess outcomes to guarantee success. This is where an Interior Design KPI Dashboard in Power BI can make a significant difference. In this article, we’ll explore the importance of KPIs (Key Performance Indicators) for interior designers, how to design an effective dashboard, and how Power BI enhances the process by offering actionable insights.
Click to Purchase Interior Design KPI Dashboard in Power BI
What is an Interior Design KPI Dashboard in Power BI?
An Interior Design KPI Dashboard in Power BI is a tool that helps interior designers and firms track and analyze key metrics. These metrics represent critical aspects of a design project, such as budget adherence, project timelines, client satisfaction, and resource utilization. By integrating this data into a Power BI dashboard, businesses gain an interactive and visually appealing tool that can instantly showcase whether they are on track to meet their goals or if any adjustments are necessary.
This dashboard uses Power BI, a powerful business analytics tool from Microsoft, to aggregate data and transform it into easy-to-read charts, tables, and visuals. It helps decision-makers, designers, and stakeholders monitor performance against targets, ensuring efficiency and alignment with overall business goals.
Key Features of the Interior Design KPI Dashboard in Power BI
The Interior Design KPI Dashboard includes three primary pages in Power BI, each designed to capture, analyze, and present data effectively. These pages are:
Summary Page: The Heart of the Dashboard
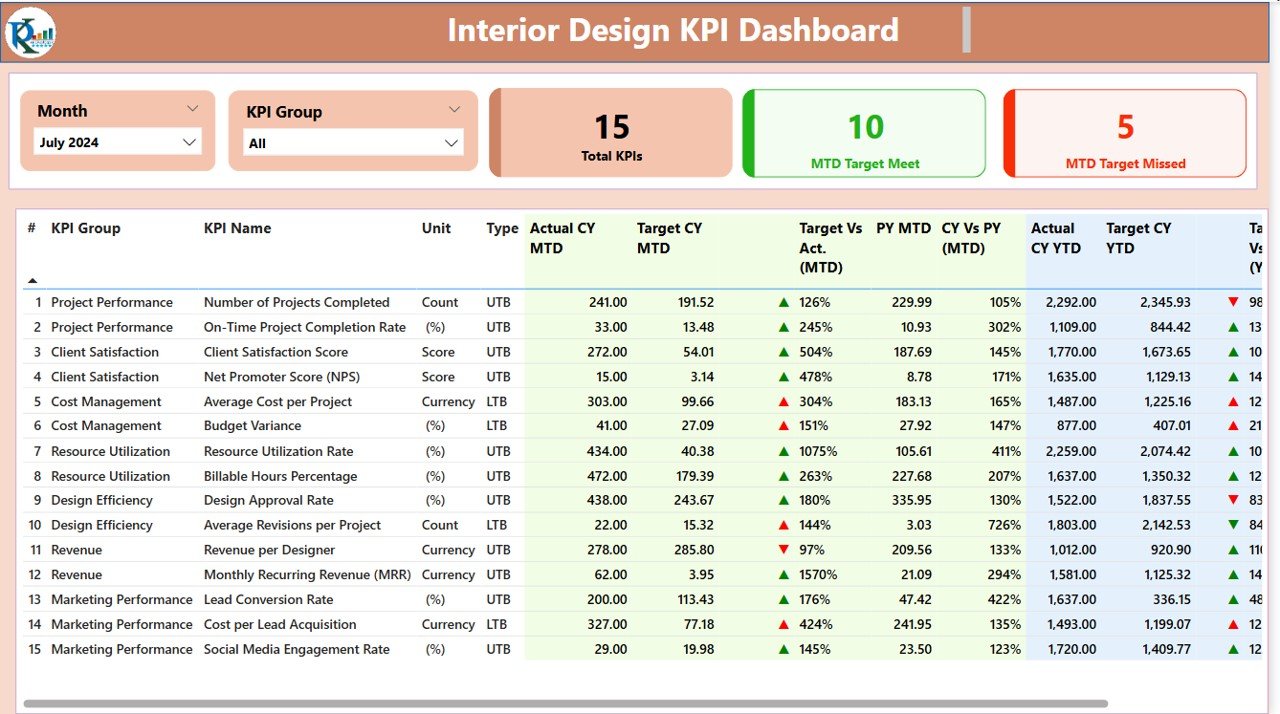
The Summary Page acts as the central hub of the dashboard, providing an overview of key KPIs. This page includes the following components:
Month and KPI Group Slicer: These slicers allow users to filter the data based on specific months and KPI groups for better visibility.
KPI Overview Cards: Three cards show essential KPI statistics, including the total number of KPIs, the number of KPIs that met the target (MTD Target Meet), and the number that missed the target (MTD Target Missed).
Detailed KPI Table: Below the cards, a detailed table displays crucial KPI data, including:
- KPI Number: The sequence number for each KPI.
- KPI Group: The group or category the KPI belongs to (e.g., Budget, Timeline, Resources).
- KPI Name: The specific name of the KPI.
- Unit: The unit of measurement (e.g., hours, dollars, percentage).
- Type: The type of KPI, such as LTB (Lower the Better) or UTB (Upper the Better).
- Actual CY MTD: Actual values for the current year, month-to-date (MTD).
- Target CY MTD: The target values for the current year, month-to-date.
- MTD Icon: Green or red arrows indicating whether the actual values meet or miss the targets.
- Target vs. Actual (MTD): A percentage comparison between the target and actual MTD numbers.
- Previous Year MTD: MTD numbers from the previous year for comparison.
- CY vs PY (MTD): The percentage change between the current year and previous year MTD data.
- Actual CY YTD: Year-to-date (YTD) actual values for the current year.
- Target CY YTD: YTD target values for the current year.
- YTD Icon: Green or red arrows indicating whether the actual YTD values meet or miss the targets.
- Target vs. Actual (YTD): A percentage comparison between the target and actual YTD numbers.
- Previous Year YTD: YTD data from the previous year for comparison.
- CY vs PY (YTD): The percentage change between the current year and previous year YTD data.
Click to Purchase Interior Design KPI Dashboard in Power BI
KPI Trend Page: Visualizing Data Over Time
The KPI Trend Page allows users to visualize the trends for KPIs over time. It includes two combo charts:
- MTD and YTD Trends: These combo charts track the actual numbers, previous year’s numbers, and the targets for each KPI across months (MTD) and years (YTD). Users can compare performance over different periods and analyze trends to identify areas for improvement.
- KPI Name Slicer: This slicer allows users to select a specific KPI to focus on and explore the trends related to that particular metric.
KPI Definition Page: A Deeper Dive into KPIs
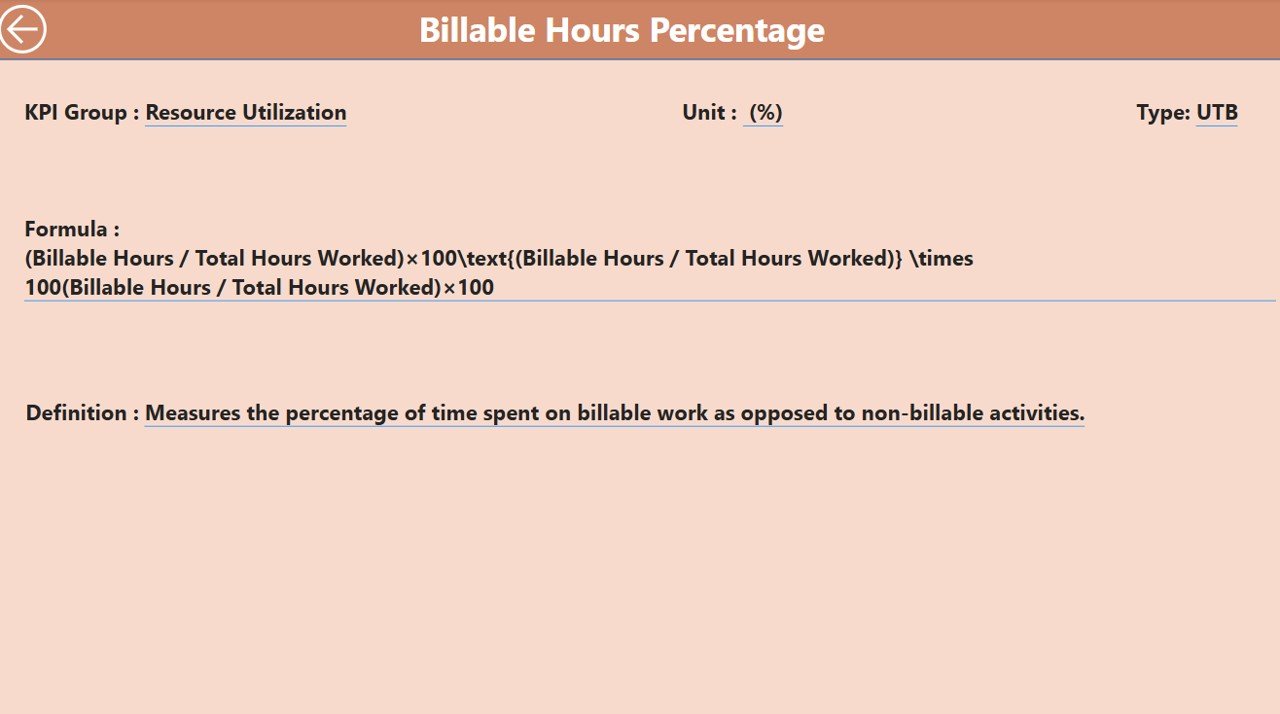
The KPI Definition Page is a drill-through page that provides detailed definitions and formulas for each KPI. This page is hidden from the main view but can be accessed by drilling through from the Summary Page. It includes:
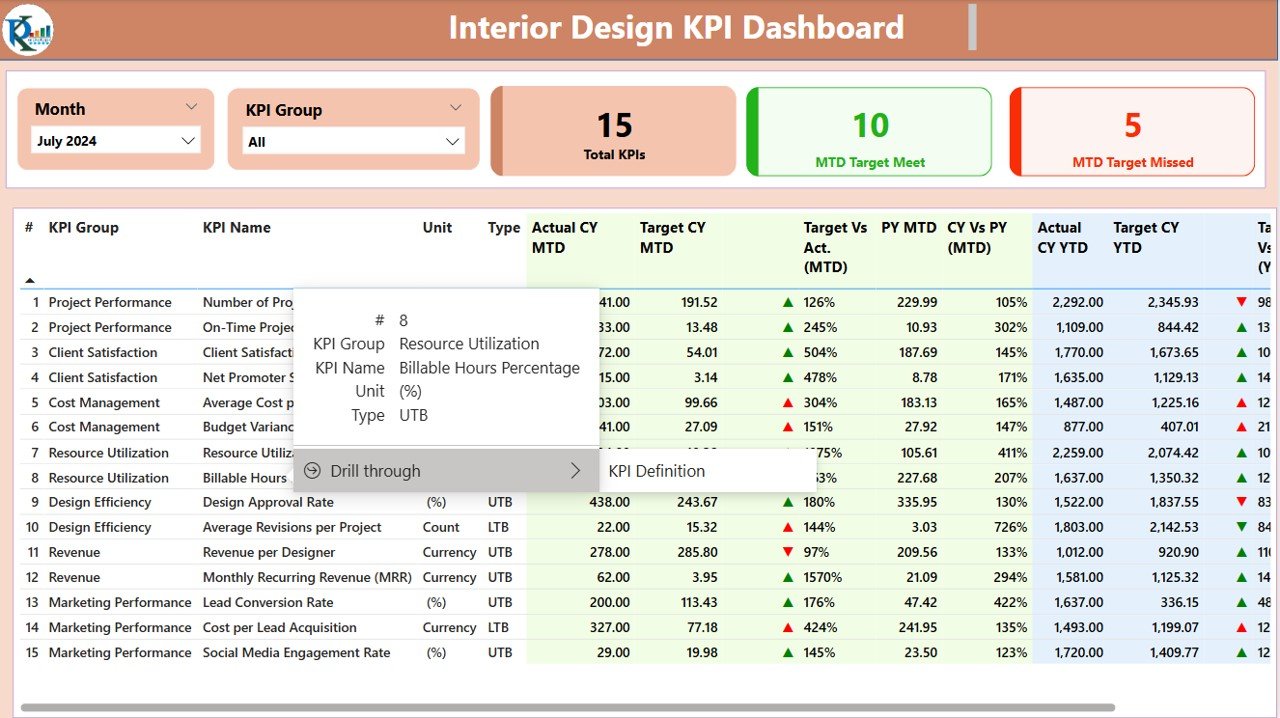
- Formula: The calculation method for each KPI.
- Definition: A detailed explanation of what the KPI measures and how it relates to the project’s success.
Users can navigate back to the main page by clicking the back button at the top left corner of the KPI Definition Page.
Advantages of Using an Interior Design KPI Dashboard in Power BI
An Interior Design KPI Dashboard brings several key advantages to interior designers and businesses in the field:
- Real-time Tracking and Insights: With Power BI, you get real-time data updates that allow you to track KPIs instantly. You no longer have to wait for monthly or quarterly reports to get insights into your project’s progress. This leads to more responsive decision-making and faster issue resolution.
- Interactive and Customizable Visuals: The interactive nature of Power BI dashboards allows users to drill into data, select specific KPIs, and adjust timeframes. This ensures that stakeholders can view the exact data they need, customized to their unique needs.
- Easy Collaboration: Power BI dashboards can be easily shared with other team members, stakeholders, and clients, enabling better collaboration. Everyone can stay on the same page, making sure that targets are aligned and strategies are executed efficiently.
- Enhanced Decision-Making: The clear and visually appealing charts and tables make it easier to interpret complex data. With Power BI’s data analysis capabilities, users can make informed decisions that improve project outcomes, cost-efficiency, and overall business performance.
- Comprehensive Reporting: Power BI allows for the integration of data from various sources, providing comprehensive reporting capabilities. You can combine project-related data from Excel, customer feedback, financial figures, and more, creating a holistic view of your interior design business.
Opportunities for Improvement in Interior Design KPI Dashboards
While an Interior Design KPI Dashboard is a powerful tool, there are always opportunities for improvement. Here are some areas to focus on:
- Data Accuracy: Ensure that the data entered into the system is accurate and consistent. Incorrect data will lead to inaccurate KPIs, making the dashboard ineffective.
- Advanced Analytics: Consider integrating more advanced analytics features, such as predictive analytics, to forecast future performance trends. By doing so, you can anticipate potential challenges and proactively address them.
- Mobile Accessibility: With more professionals working remotely or on-the-go, optimizing your dashboard for mobile devices can enhance accessibility and usability. Mobile access allows users to track KPIs no matter where they are.
- Integrating External Data Sources: For even deeper insights, consider integrating data from third-party project management tools or customer satisfaction surveys. This will provide a fuller picture of your projects’ success.
Best Practices for Using the Interior Design KPI Dashboard in Power BI
To get the most out of your Interior Design KPI Dashboard in Power BI, follow these best practices:
- Keep KPIs Simple and Focused: Don’t overwhelm users with too many KPIs. Focus on a few critical metrics that truly reflect project success. This keeps the dashboard easy to understand and more effective for decision-making.
- Ensure Data Quality: Consistently update and verify the data that feeds into your dashboard. Inaccurate or outdated data can lead to incorrect insights, causing unnecessary confusion and delays.
- Leverage Interactive Features: Make use of slicers, filters, and drill-through capabilities to give users the flexibility to explore the data. The more interactive your dashboard, the more valuable it becomes for diverse teams and stakeholders.
- Provide Training for Users: Ensure that everyone who uses the dashboard understands how to navigate it effectively. This will maximize the utility of the tool, ensuring that it is used to its full potential.
- Use Clear Visuals: for clean, simple, and easy-to-read visuals. Overly complex charts or clashing colors can confuse users. Choose visuals that best convey the data while remaining visually appealing and intuitive.
Conclusion
An Interior Design KPI Dashboard in Power BI offers interior designers a comprehensive, real-time tool for tracking their projects’ success. With its interactive visuals, real-time updates, and detailed analysis, this dashboard helps teams stay on track with their goals, improve decision-making, and ensure that projects are delivered on time and within budget. By following best practices and continually improving the dashboard’s features, you can unlock even greater value from this tool and elevate your design business to new heights.
Frequently Asked Questions
What is a KPI in Interior Design?
A KPI (Key Performance Indicator) in interior design is a measurable value that indicates how effectively a designer or firm is achieving its project goals. These KPIs may include metrics like budget adherence, project timelines, and client satisfaction.
How do I track KPIs in Power BI?
You can track KPIs in Power BI by importing data from your Excel files into Power BI and setting up visualizations such as charts, tables, and graphs. Power BI allows you to easily monitor real-time data and compare it with set targets.
What are the benefits of using a KPI Dashboard for Interior Designers?
Using a KPI dashboard allows interior designers to track key metrics in real-time, make data-driven decisions, and improve project outcomes. It enhances collaboration, ensures projects meet client expectations, and provides valuable insights for continuous improvement.
Can Power BI integrate with other software tools?
Yes, Power BI can integrate with various other software tools, such as project management platforms, financial software, and customer relationship management (CRM) systems, providing a comprehensive view of your interior design business’s performance.
Is it difficult to set up a KPI Dashboard in Power BI?
Setting up a KPI Dashboard in Power BI may take some time, but it’s relatively straightforward once you have the right data sources in place. If you’re unfamiliar with Power BI, consider taking a course or seeking expert help to get the most out of the platform.
Visit our YouTube channel to learn step-by-step video tutorials
View this post on Instagram