Effective internal communication is essential for any organization to thrive. Tracking and analyzing communication metrics can help businesses improve engagement, collaboration, and overall efficiency. This is where an Internal Communications KPI Dashboard in Excel comes into play.
This dashboard provides a structured and data-driven approach to measure key internal communication metrics. With the ability to track Monthly-to-Date (MTD) and Year-to-Date (YTD) performance, this tool is an excellent way to ensure that communication strategies align with business goals.
In this article, we will explore how to use this dashboard, its features, best practices, and common FAQs.
Click to Internal Communications KPI
Key Features of the Internal Communications KPI Dashboard
This ready-to-use Excel dashboard consists of seven worksheets that help manage, track, and analyze internal communication KPIs effectively.
Home Sheet
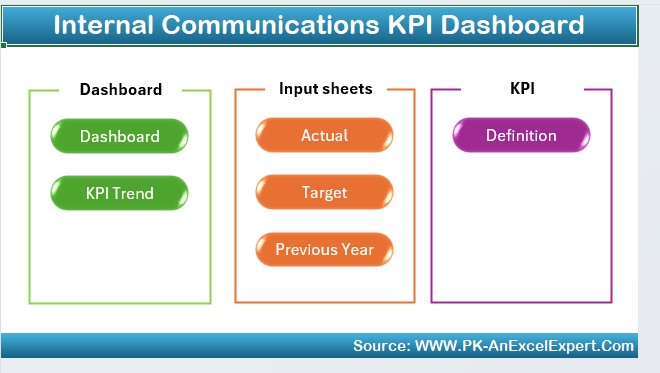
- The Home Sheet acts as an index page with six buttons that allow users to navigate to different sections of the dashboard quickly.
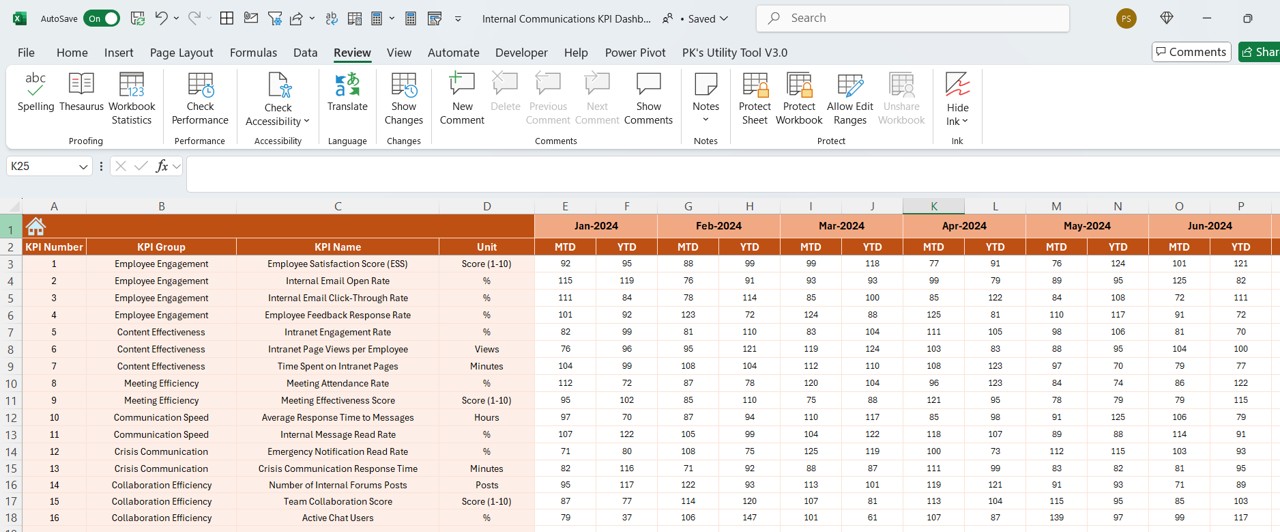
Dashboard Sheet Tab
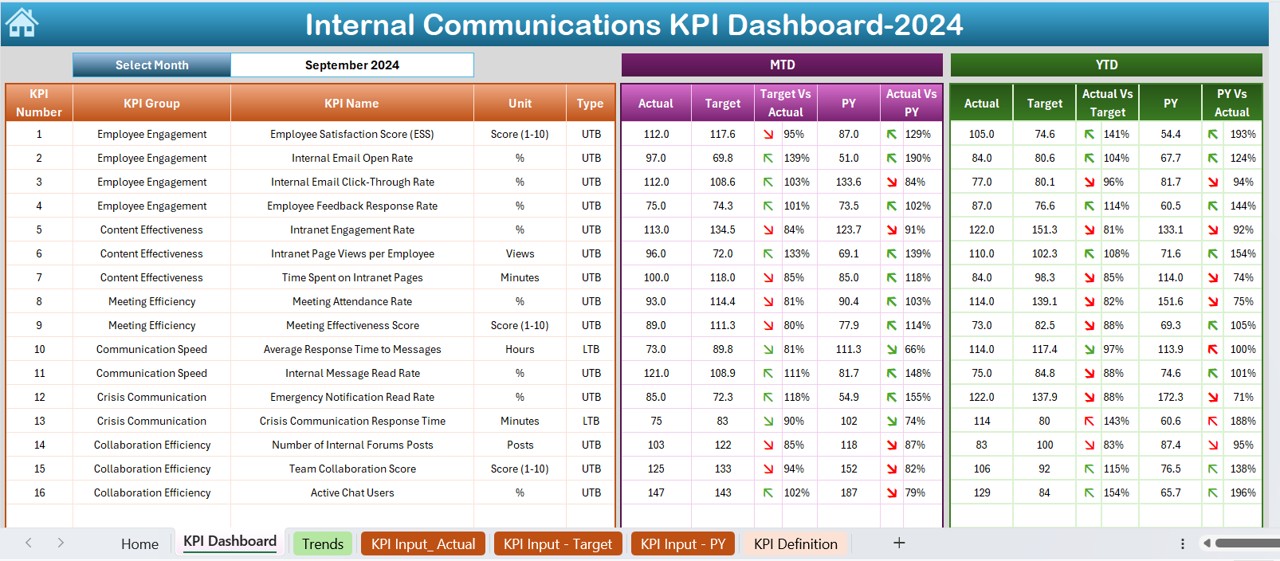
- The Dashboard Sheet is the core of the KPI dashboard, presenting all essential metrics. Key functionalities include:
- Monthly Selection (Dropdown in D3): Users can select a specific month, and the dashboard updates automatically.
- MTD and YTD KPI Analysis:
- Actual performance
- Target values
- Previous year’s data
- Conditional formatting with up/down arrows to indicate trends.
Click to Internal Communications KPI
KPI Trend Sheet Tab
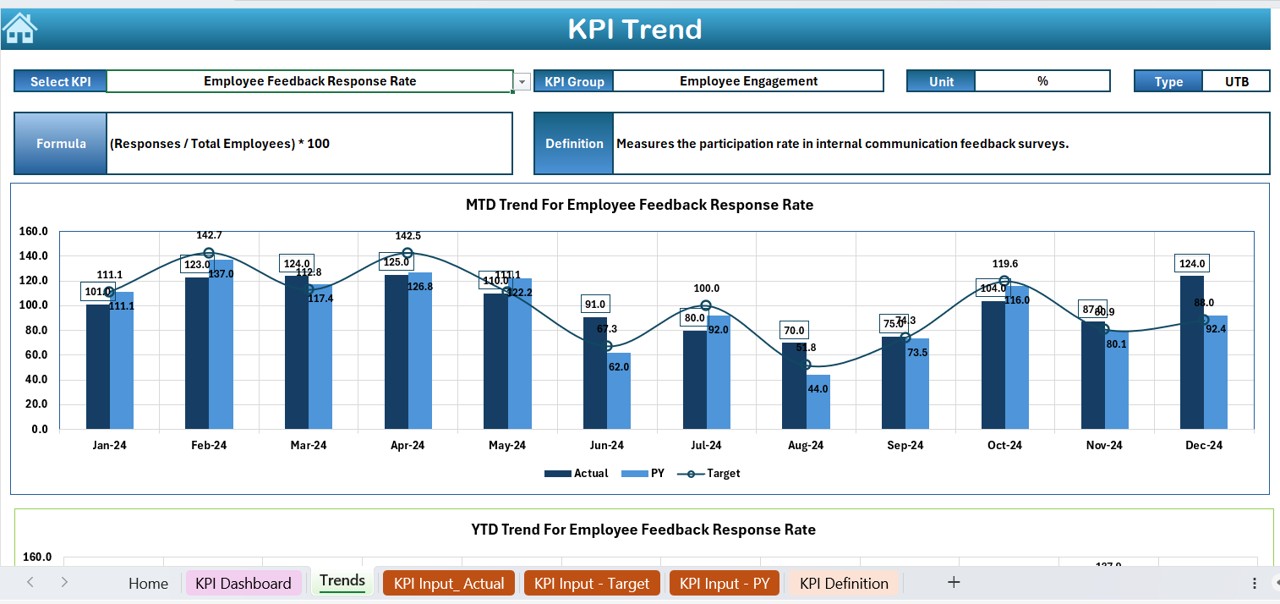
- The KPI Trend Sheet provides historical trends for different KPIs. Key elements include:
- Dropdown for KPI Selection (C3) to analyze a specific metric.
KPI Details Display:
- KPI Group
- Measurement Unit
- Type (Lower is better / Upper is better)
- KPI Formula and Definition
Graphical Trend Representation: MTD and YTD actual vs. target values displayed in an easy-to-understand chart.
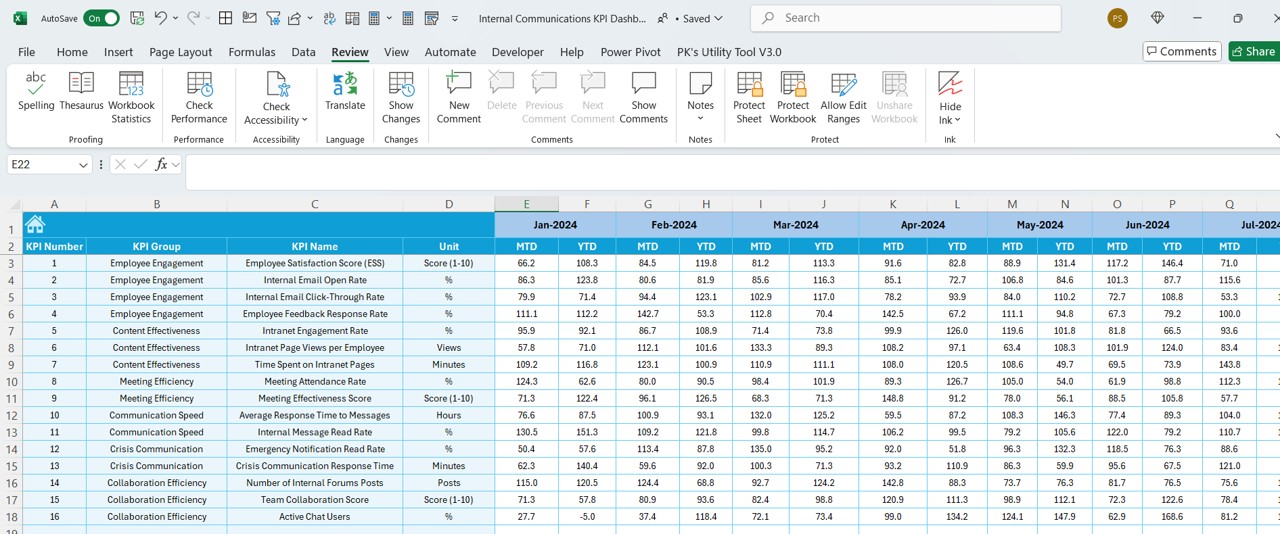
Actual Numbers Input Sheet
- This sheet is designed for inputting actual communication KPI values for different months. Users can:
- Modify months dynamically by changing E1 (First month of the year).
- Input actual numbers for different KPIs on an MTD and YTD basis.
Click to Internal Communications KPI
Target Sheet Tab
- Users must input target values for each KPI in this sheet. This includes:
- MTD and YTD Targets for each KPI.
- A structured format to compare actual performance with predefined targets.
Previous Year Number Sheet Tab
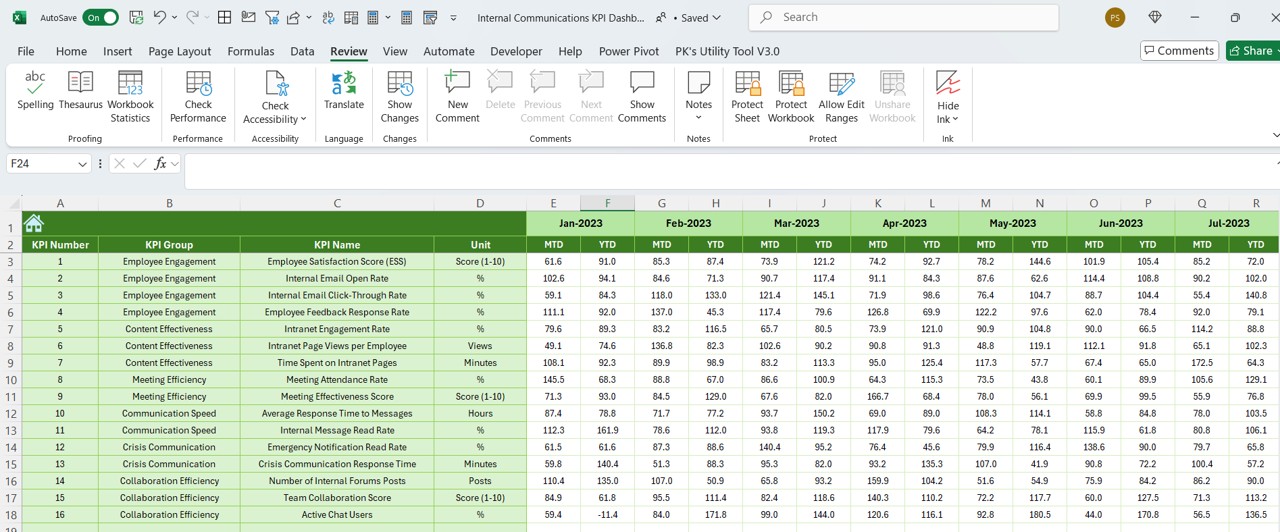
- This sheet holds the historical data of the previous year. Users must enter:
- KPI values from the same period of the last year.
- Historical data helps in benchmarking and trend analysis.
Click to Internal Communications KPI
KPI Definition Sheet Tab
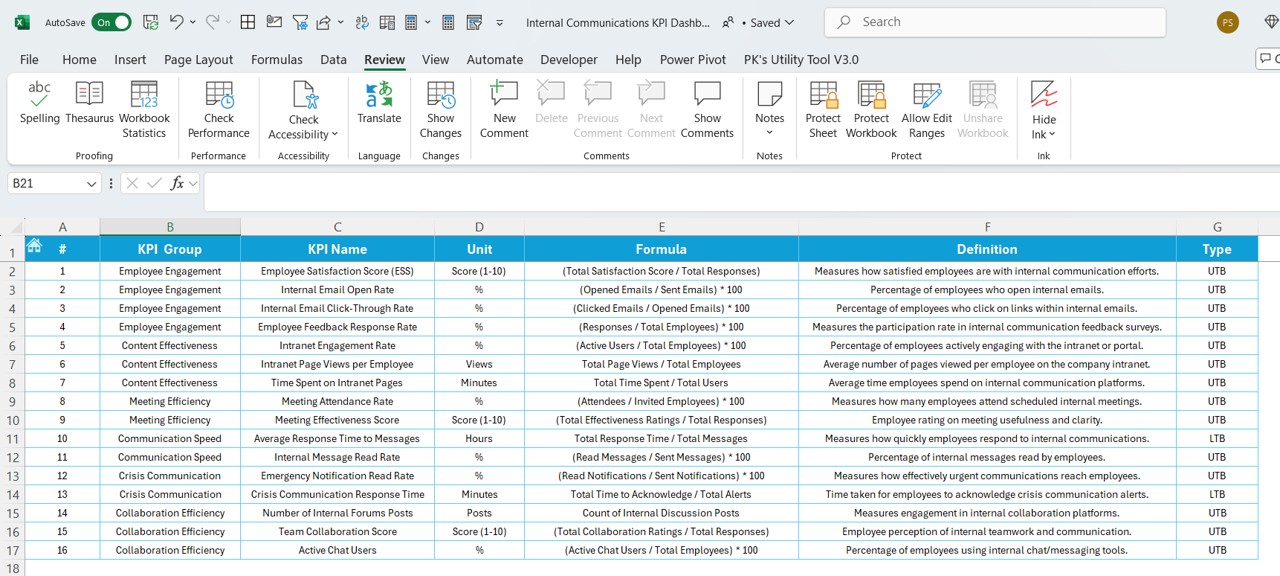
This sheet provides a detailed description of each KPI to ensure clarity. Users must fill in:
- KPI Name
- KPI Group
- Unit of Measurement
- KPI Formula
- KPI Definition
Advantages of Using the Internal Communications KPI Dashboard
- Data-Driven Decision Making: This dashboard offers real-time insights, allowing organizations to make informed decisions based on actual performance data.
- Improved Communication Strategy: By tracking KPI trends, businesses can identify weak areas and adjust their internal communication strategy accordingly.
- Performance Benchmarking: Comparing current performance with previous year’s data and set targets enables effective benchmarking.
- Automated Data Visualization: Graphs and conditional formatting automatically update, making analysis easier and faster.
- User-Friendly Interface: With dropdown menus and structured sheets, this dashboard is easy to use, even for those with limited Excel expertise.
Best Practices for Using the Internal Communications KPI Dashboard
- Ensure Data Accuracy: Always enter the correct actual, target, and previous year data in the respective sheets to get reliable insights.
- Regularly Update KPI Definitions: As internal communication evolves, KPI definitions and formulas should be updated accordingly.
- Monitor Trends, Not Just Single Data Points: Use the KPI Trend Sheet to identify long-term patterns instead of focusing only on single-month data.
- Customize as Per Organizational Needs: Modify KPI formulas or add new ones to align with your company’s specific internal communication goals.
- Use Conditional Formatting for Better Visualization: Utilize Excel’s conditional formatting (e.g., up/down arrows, color-coded cells) to highlight performance variations.
Conclusion
An Internal Communications KPI Dashboard in Excel is a powerful tool for businesses aiming to enhance internal communication efficiency. By leveraging real-time tracking, trend analysis, and data visualization, organizations can optimize their communication strategies and improve employee engagement.
Frequently Asked Questions (FAQs)
What is an Internal Communications KPI?
An Internal Communications KPI is a measurable value that tracks the efficiency of internal communication within an organization. It helps assess engagement, message reach, response rates, and overall communication effectiveness.
How do I customize the KPI Dashboard for my business?
You can:
- Modify KPI formulas based on organizational needs.
- Add new KPI categories in the KPI Definition sheet.
- Adjust conditional formatting to align with your reporting style.
Can I use this dashboard for other departments?
Yes! While designed for internal communication, you can tweak the dashboard for tracking HR, Sales, or Customer Service KPIs.
How often should I update the KPI data?
It is recommended to update the data monthly to ensure accurate performance tracking and trend analysis.
Click to Internal Communications KPI
Visit our YouTube channel to learn step-by-step video tutorials
View this post on Instagram