In today’s rapidly evolving IT landscape, effective IT operations management plays a crucial role in ensuring that technology services run smoothly, meet business objectives, and support organizational growth. One of the most efficient ways to monitor IT operations is through a KPI Dashboard. A well-designed IT Operations KPI Dashboard provides real-time insights into key performance indicators (KPIs), enabling teams to track, assess, and improve their operational efficiency.
In this article, we’ll explore everything you need to know about the IT Operations KPI Dashboard, including its key features, the most important KPIs to track, and how to implement them. Whether you are an IT manager or a business leader, this guide will equip you with the necessary tools to improve your IT operations through actionable insights.
What is an IT Operations KPI Dashboard?
An IT Operations KPI Dashboard is a visual tool that enables IT managers and teams to monitor, track, and analyze critical metrics related to the performance of IT systems, infrastructure, and services. This dashboard aggregates various KPIs that reflect the operational health of IT processes, ensuring that any issues are identified quickly and can be addressed before they escalate into significant problems.
Key Features of the IT Operations KPI Dashboard
The IT Operations KPI Dashboard comes with a ready-to-use template that is designed to simplify tracking and reporting. Below are the key features of this KPI Dashboard, which is equipped with 7 essential worksheets:
Home Sheet:
This sheet acts as the index, offering users easy access to the other sections. It includes six buttons that allow you to quickly jump to the relevant worksheet.

Click to IT Operations KPI
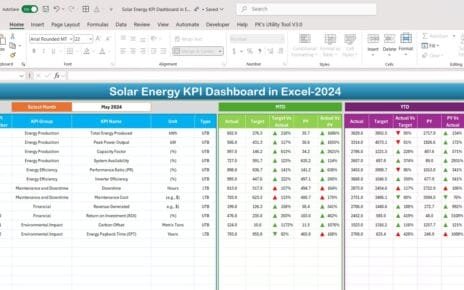
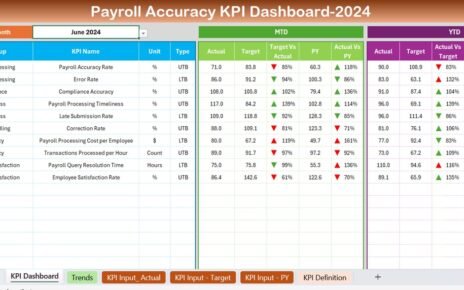
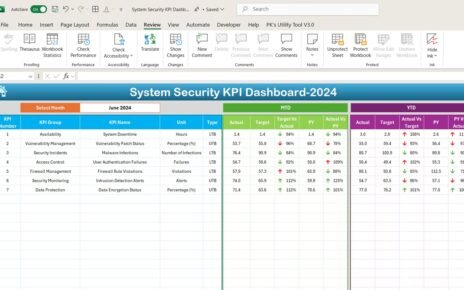
Dashboard Sheet Tab:
The main sheet of the dashboard displays all the KPIs in a single view. It features a month selection drop-down (range D3), allowing you to view data for any specific month. The following information is displayed for each KPI:
- MTD (Month to Date): Actual numbers, Target, and Previous Year (PY) data.
- YTD (Year to Date): Actual numbers, Target, and Previous Year data.
- Target vs Actual and PY vs Actual comparisons with conditional formatting showing up/down arrows for performance fluctuations.

Click to IT Operations KPI
KPI Trend Sheet Tab:
This sheet allows you to select a KPI from the drop-down menu (range C3). It displays:
- KPI Group
- Unit of KPI
- Type of KPI (Lower the better or Upper the better)
- Formula to calculate the KPI
- Detailed Definition of the KPI

Actual Number Sheet Tab:
Here, you enter the actual data for both YTD and MTD for a given month. The month can be changed dynamically from range E1, where you can input the first month of the year.

Click to IT Operations KPI
Target Sheet Tab:
This tab is where you input target numbers for each KPI, both for the month (MTD) and year (YTD).

Click to IT Operations KPI
Previous Year Number Sheet Tab:
This sheet allows you to input previous year’s data, which is essential for making comparisons with current-year performance.

Click to IT Operations KPI
KPI Definition Sheet Tab:
This tab contains detailed information for each KPI, including:
- KPI Name
- KPI Group
- Unit of Measurement
- Formula for KPI calculation
- Detailed KPI Definition

Click to IT Operations KPI
Advantages of IT Operations KPIs
- Improved Performance Monitoring: KPIs provide real-time insights into the performance of IT operations, helping teams identify issues before they escalate.
- Better Decision-Making: By having data-driven metrics, IT managers can make informed decisions that directly affect the quality and efficiency of operations.
- Increased SLA Compliance; Monitoring SLA compliance ensures that IT services meet business expectations and customer needs, enhancing client satisfaction.
- Faster Incident Response; By tracking metrics like Incident Resolution Time and MTTR, IT teams can respond to incidents faster, reducing downtime and improving overall system availability.
Opportunities for Improvement in IT Operations
- Enhance Incident Management: Focus on improving First Contact Resolution rates and reducing the Incident Resolution Time by streamlining workflows and training IT support teams more effectively.
- Improve System Uptime: Invest in preventative maintenance and better monitoring tools to ensure systems stay up and running, minimizing downtime.
- Optimize SLA Compliance: Regularly review and update SLAs to reflect current service capabilities and ensure they are realistic and achievable for the IT team.
- Refine Patch Management: Improve patch management processes to ensure all systems are regularly updated and secure, reducing the risk of vulnerabilities.
Best Practices for IT Operations KPIs
- Set Clear Targets for Each KPI: Define clear and realistic goals for each KPI based on historical data, industry standards, and business requirements.
- Regularly Review KPI Performance: Regularly monitor and analyze the performance of each KPI to ensure that IT operations are continuously improving.
- Collaborate Across Teams: Encourage cross-functional collaboration between IT support, development, and operations teams to improve performance in key areas.
- Leverage Automation: Use automation tools to streamline processes such as incident resolution, patch management, and reporting, making it easier to track and improve KPIs.
Conclusion
The IT Operations KPI Dashboard is an essential tool for managing and improving IT performance. By focusing on the right KPIs and continuously monitoring them, IT teams can ensure system reliability, reduce downtime, and optimize incident response. Whether you are tracking System Uptime, SLA Compliance, or Incident Resolution Time, this dashboard provides the data-driven insights needed to improve your IT operations.
Frequently Asked Questions (FAQs)
1. What is the purpose of an IT Operations KPI Dashboard?
An IT Operations KPI Dashboard helps track and analyze the performance of IT services, enabling teams to optimize operations, reduce downtime, and improve efficiency.
2. How often should I update the IT Operations KPIs?
It is recommended to update KPIs regularly, at least on a monthly basis, to track progress, identify trends, and make data-driven decisions.
3. What KPIs should be included in an IT Operations Dashboard?
Important KPIs include System Uptime, Incident Resolution Time, SLA Compliance, First Contact Resolution, and Patch Management Compliance.
4. Can these KPIs be customized for different organizations?
Yes, the KPIs can be customized based on the specific needs and goals of each organization.
Visit our YouTube channel to learn step-by-step video tutorials