In the competitive world of digital marketing, tracking keyword performance is essential for measuring the effectiveness of your SEO strategy. A Keyword Performance KPI Dashboard in Excel helps you monitor key metrics, analyze trends, and make data-driven decisions to optimize your website’s search visibility.
This guide will walk you through how to use a Keyword Performance KPI Dashboard, its key features, and best practices to get the most out of your keyword tracking efforts.
Click to Keyword Performance KPI
What is a Keyword Performance KPI Dashboard?
A Keyword Performance KPI Dashboard is an Excel-based template designed to track essential Key Performance Indicators (KPIs) related to keyword rankings, search volume, traffic, and conversions. It provides a visual representation of data trends, making it easier to assess the impact of SEO strategies.
Key Features of the KPI Dashboard
This Keyword Performance KPI Dashboard includes 7 worksheets, each serving a unique function:
Click to Keyword Performance KPI
Home Sheet
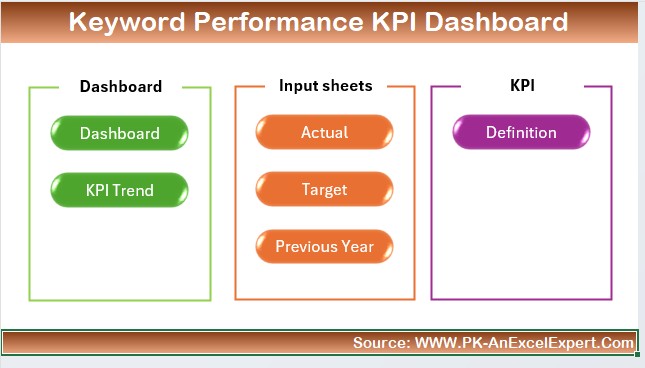
- Acts as the index page with navigation buttons.
- Allows users to jump to respective sheets quickly.
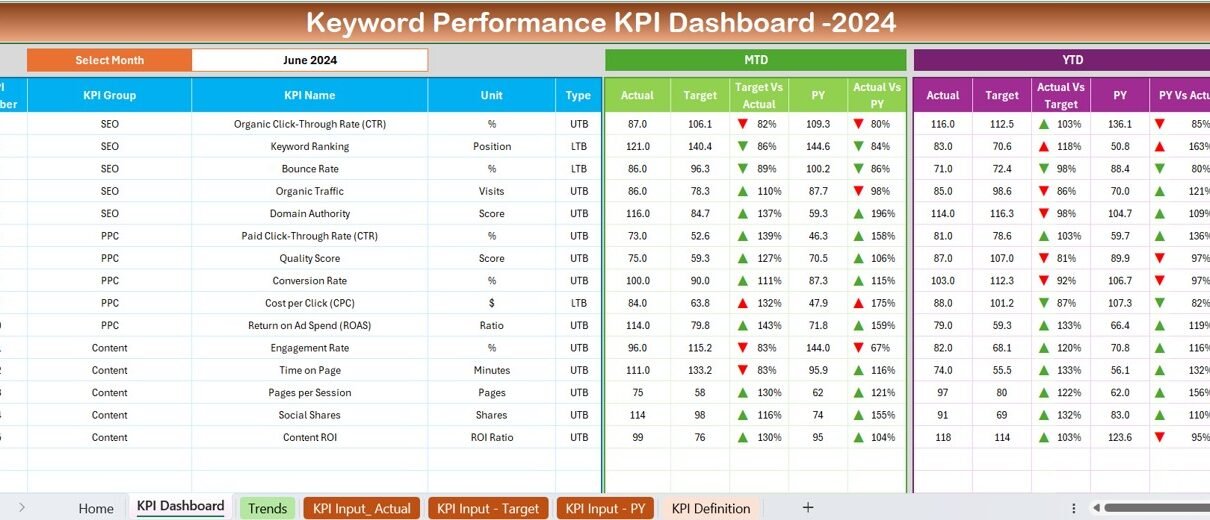
Dashboard Sheet Tab
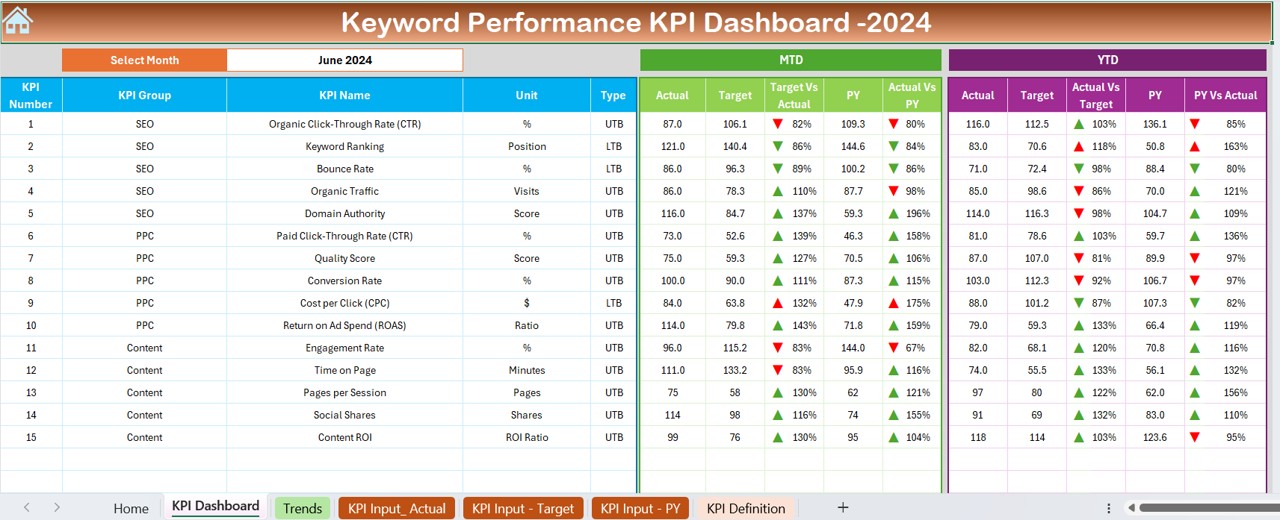
- The main dashboard displaying all KPI data.
- Includes a month selection drop-down (cell D3) to filter data dynamically.
- Displays MTD (Month-to-Date) and YTD (Year-to-Date) data.
- Tracks Actual vs Target and Previous Year vs Actual with up/down conditional formatting arrows.
Click to Keyword Performance KPI
KPI Trend Sheet Tab
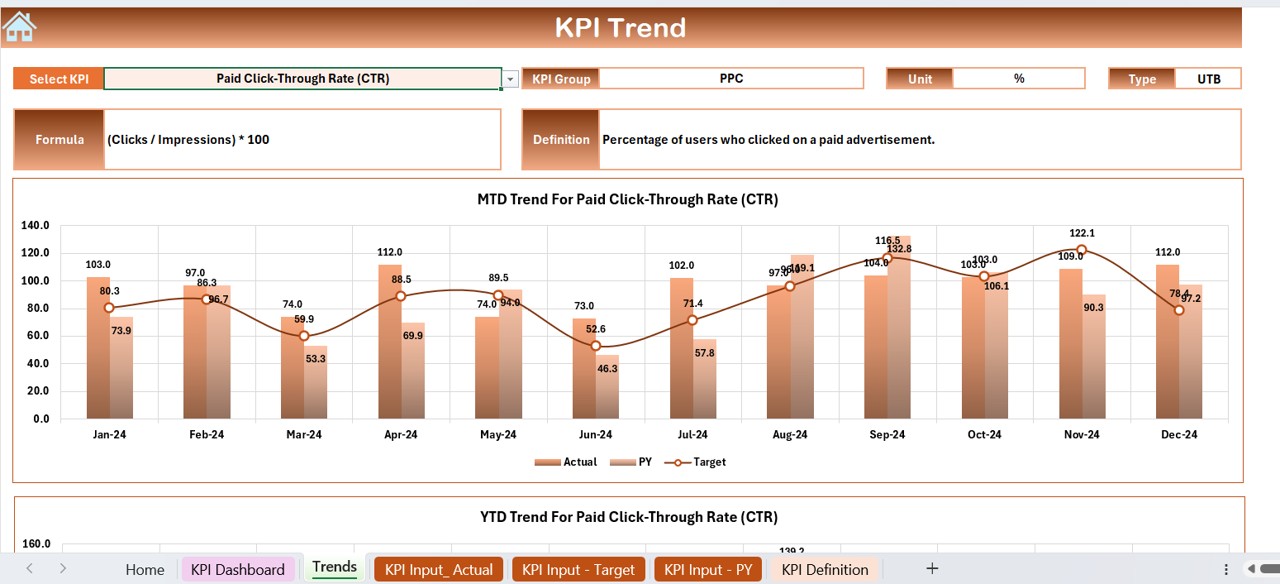
- Enables users to select a KPI (dropdown in C3) for trend analysis.
- Shows KPI group, unit, type (Lower is Better or Higher is Better), formula, and definition.
- Displays MTD and YTD trend charts for Actual, Target, and Previous Year.
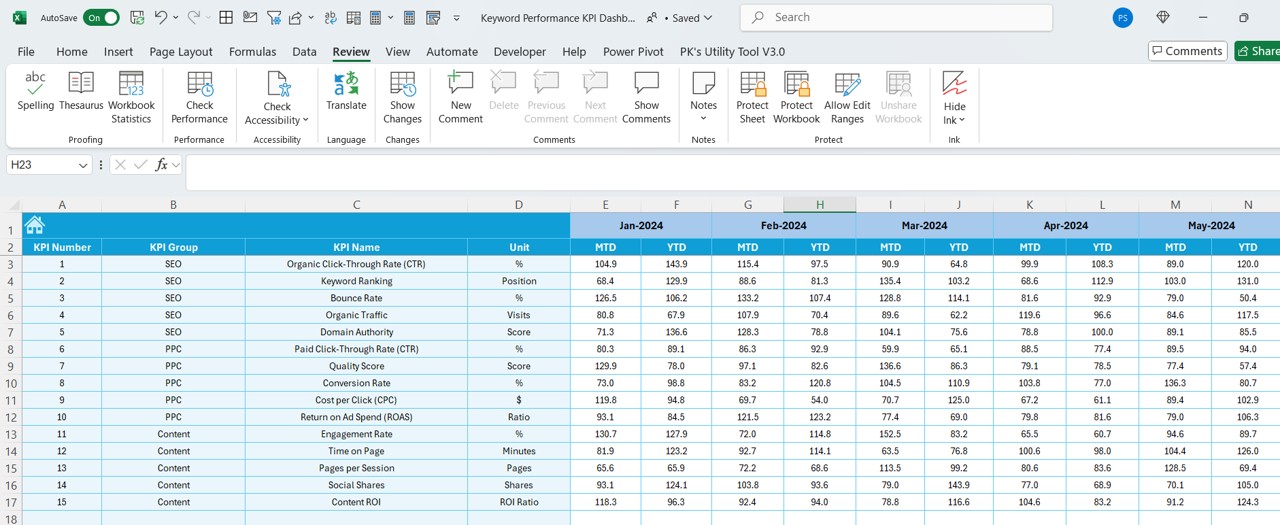
Actual Numbers Input Sheet
- Allows input of MTD and YTD actual numbers for each month.
- Users can set the starting month of the year in E1 to adjust the timeline accordingly.
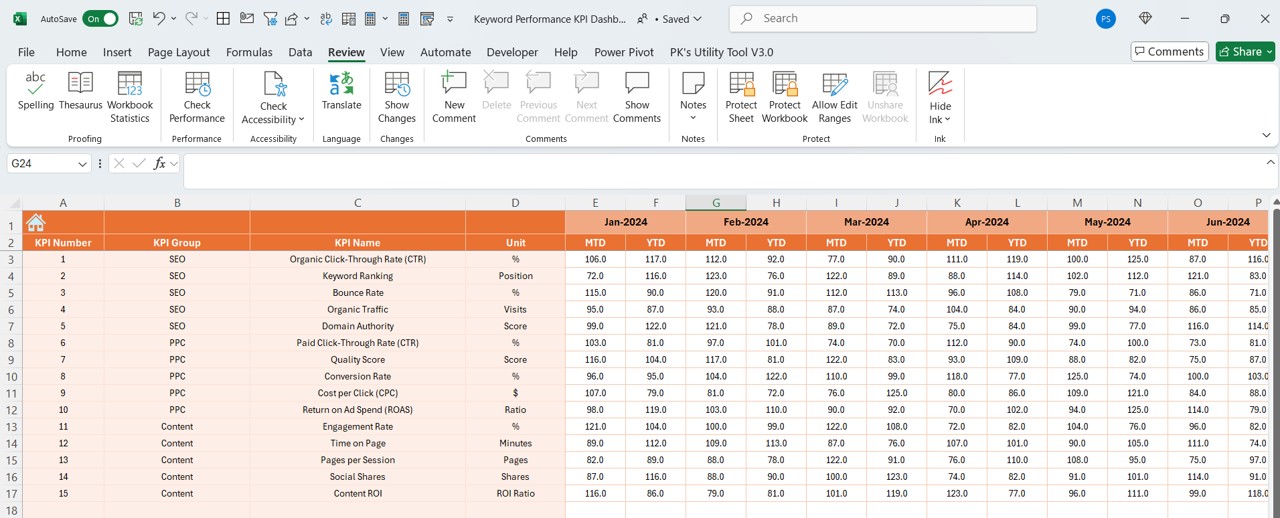
Target Sheet Tab
- Used to input monthly and YTD target numbers for each KPI.
Click to Keyword Performance KPI
Previous Year Number Sheet Tab
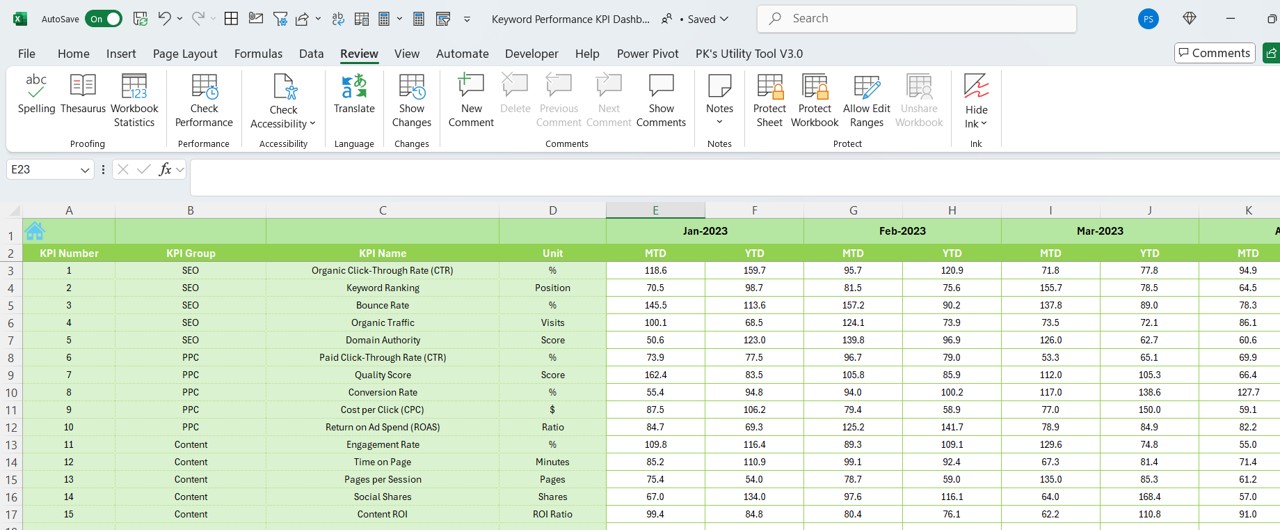
- Stores previous year’s numbers to compare with current performance.
KPI Definition Sheet Tab
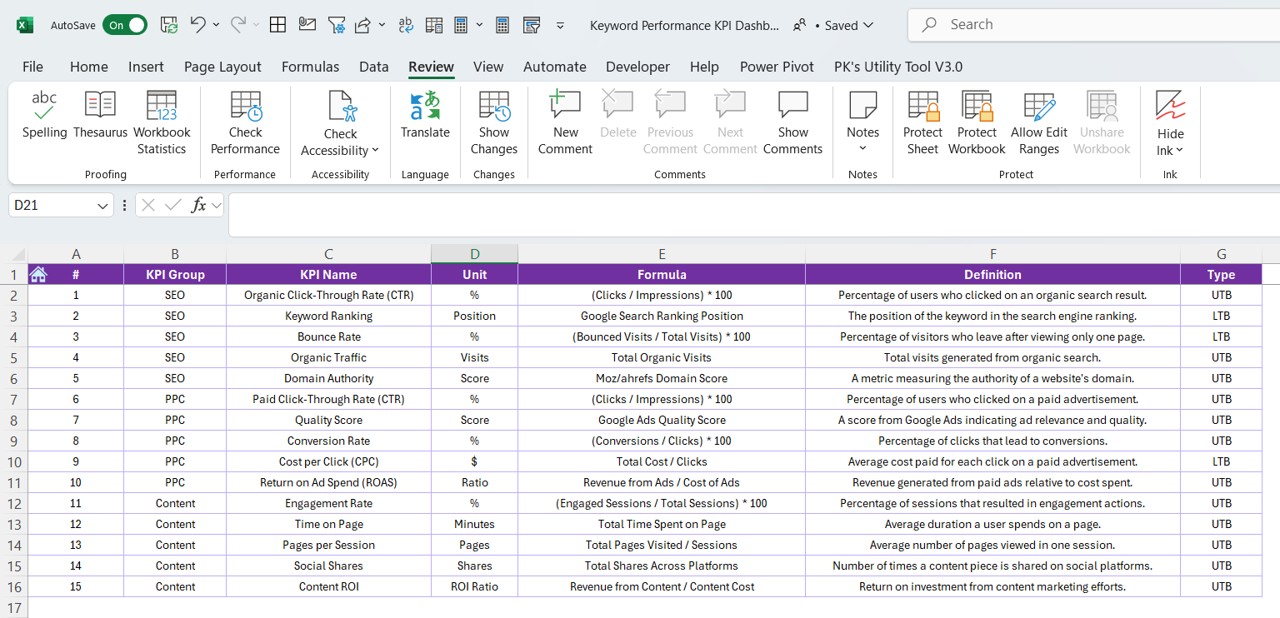
- Houses the KPI name, group, unit, formula, and definition.
Advantages of Using a Keyword Performance KPI Dashboard
Centralized Data Management
- Eliminates the need for multiple tracking tools.
- Organizes all keyword performance metrics in one place.
Dynamic and Interactive
- Allows users to select months and KPIs to analyze trends.
- Uses conditional formatting for visual cues.
Real-Time Performance Tracking
- Helps track progress towards SEO goals.
- Compares current, target, and previous year data.
Time-Saving and Efficient
- Automates data visualization.
- Reduces manual effort in tracking keyword performance.
Click to Keyword Performance KPI
Best Practices for Using the Keyword Performance KPI Dashboard
Define Clear KPIs
Ensure you have well-defined KPIs, such as:
- Keyword Ranking – Tracks the position of your keywords in SERPs.
- Search Volume – Measures the monthly search volume of targeted keywords.
- Click-Through Rate (CTR) – Evaluates the percentage of users clicking on your link.
- Conversion Rate – Assesses how well your keywords drive conversions.
Regular Data Updates
- Update Actual, Target, and Previous Year numbers monthly.
- Maintain a consistent data entry process.
Monitor Trends and Adjust Strategies
- Identify trends using the KPI Trend Sheet.
- Modify SEO strategies based on insights gained from MTD and YTD trends.
Use Conditional Formatting for Quick Insights
- Red arrows for negative trends.
- Green arrows for positive trends.
Optimize for Continuous Improvement
- Regularly assess target vs actual performance.
- Adjust keyword strategies based on past data and trends.
Click to Keyword Performance KPI
Conclusion
A Keyword Performance KPI Dashboard in Excel is an invaluable tool for tracking and analyzing keyword metrics. By leveraging its features, you can make informed decisions to improve SEO performance, monitor trends, and achieve business goals effectively.
Frequently Asked Questions (FAQs)
What is a KPI Dashboard in SEO?
A KPI Dashboard in SEO is a tool used to track key performance indicators, such as keyword rankings, search volume, and conversions, to evaluate SEO success.
How often should I update the Keyword Performance KPI Dashboard?
It’s recommended to update the dashboard monthly to track MTD and YTD performance trends accurately.
Can I customize the KPI Dashboard?
Yes! The dashboard is fully customizable. You can add more KPIs, modify formulas, and change visuals based on your requirements.
How do I track the performance of multiple keywords?
You can use the KPI Trend Sheet to select different keywords and analyze their MTD and YTD trends dynamically.
Why is comparing Previous Year data important?
Comparing data with the previous year helps in identifying growth trends and assessing the impact of your SEO strategies over time.
Click to Keyword Performance KPI
Visit our YouTube channel to learn step-by-step video tutorials
View this post on Instagram