In the world of data-driven decision-making, Key Performance Indicators (KPIs) play a crucial role in measuring success and guiding business strategies. A Knowledge Base KPI Dashboard is a powerful tool that allows businesses to monitor and evaluate their performance using well-defined KPIs. Whether you’re in customer support, IT, or any other industry that relies on a knowledge base, having an effective KPI dashboard can transform your approach to operations. In this article, we will explore everything you need to know about Knowledge Base KPI Dashboards, including the essential KPIs, how to use them, and best practices for success.
Table of Contents
ToggleWhat is a Knowledge Base KPI Dashboard?
A Knowledge Base KPI Dashboard is a visual representation of the key performance indicators (KPIs) that are vital to managing and optimizing a knowledge base. It allows you to monitor the effectiveness of your knowledge base by displaying critical metrics in a single view. This dashboard helps to track various aspects such as usage, customer satisfaction, content updates, and search success.
This ready-to-use template is designed to make managing your KPIs simple and intuitive. It’s especially useful for teams looking to make data-driven decisions, enhance customer experience, and improve content delivery.
Key Features of the Knowledge Base KPI Dashboard
Here are the key features of the Knowledge Base KPI Dashboard:
1. Home Sheet
The Home Sheet serves as the index page. It includes buttons to navigate easily to other sheets. This organized layout makes it easy to manage and access the dashboard’s various sections.
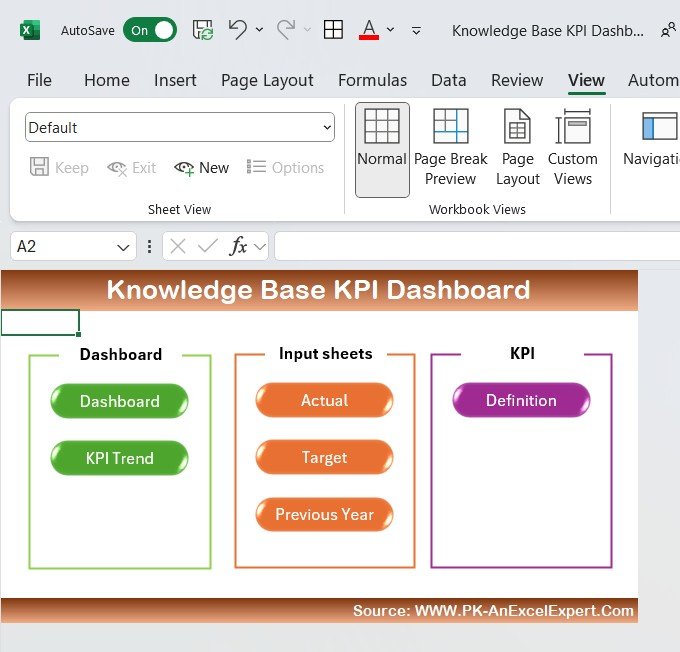
Click to Knowledge Base KPI
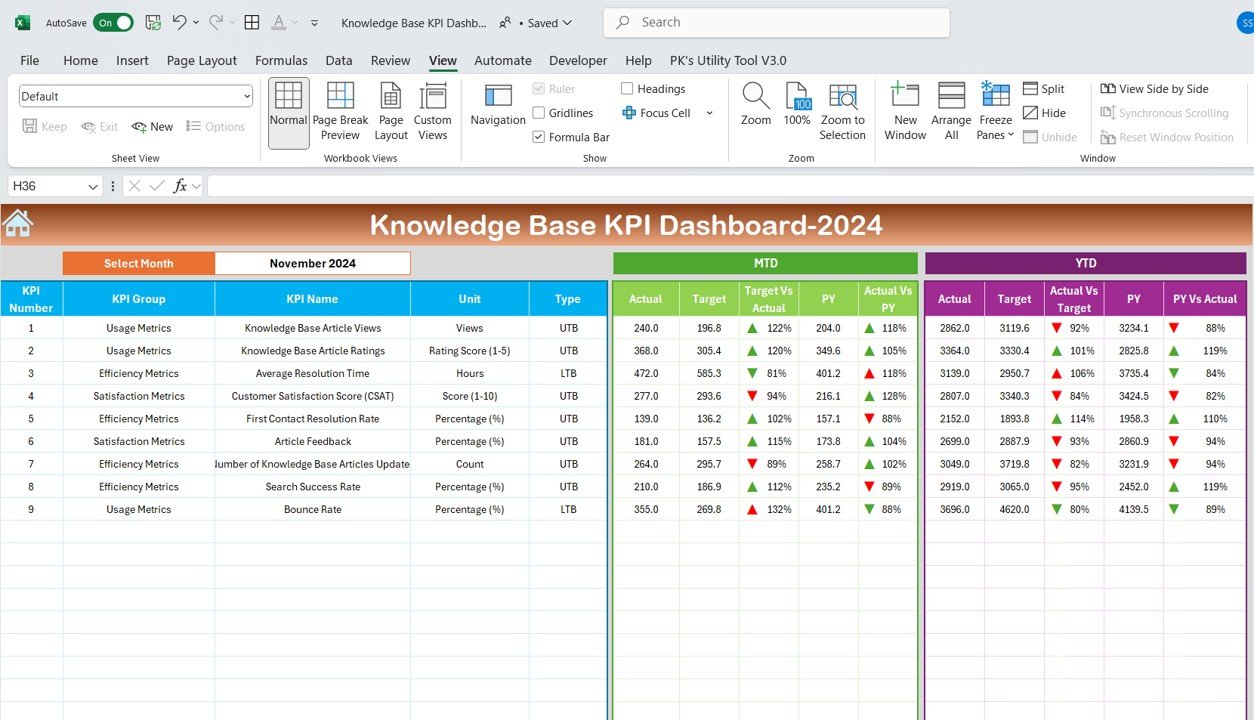
2. Dashboard Sheet Tab
This is the main sheet of the dashboard, where all KPI data is displayed. The dashboard features:
- MTD (Month-to-Date) Actual: The actual values for the selected month.
- Target: The expected value for the selected month.
- Previous Year Data: A comparison of the previous year’s data.
- Target vs Actual: A side-by-side comparison of the actual value against the target for the selected month.
- YTD (Year-to-Date) Actual: The actual data accumulated from the beginning of the year to the selected month.
Conditional formatting is used to show up/down arrows for easy visualization of whether the KPI is performing as expected.
Click to Knowledge Base KPI
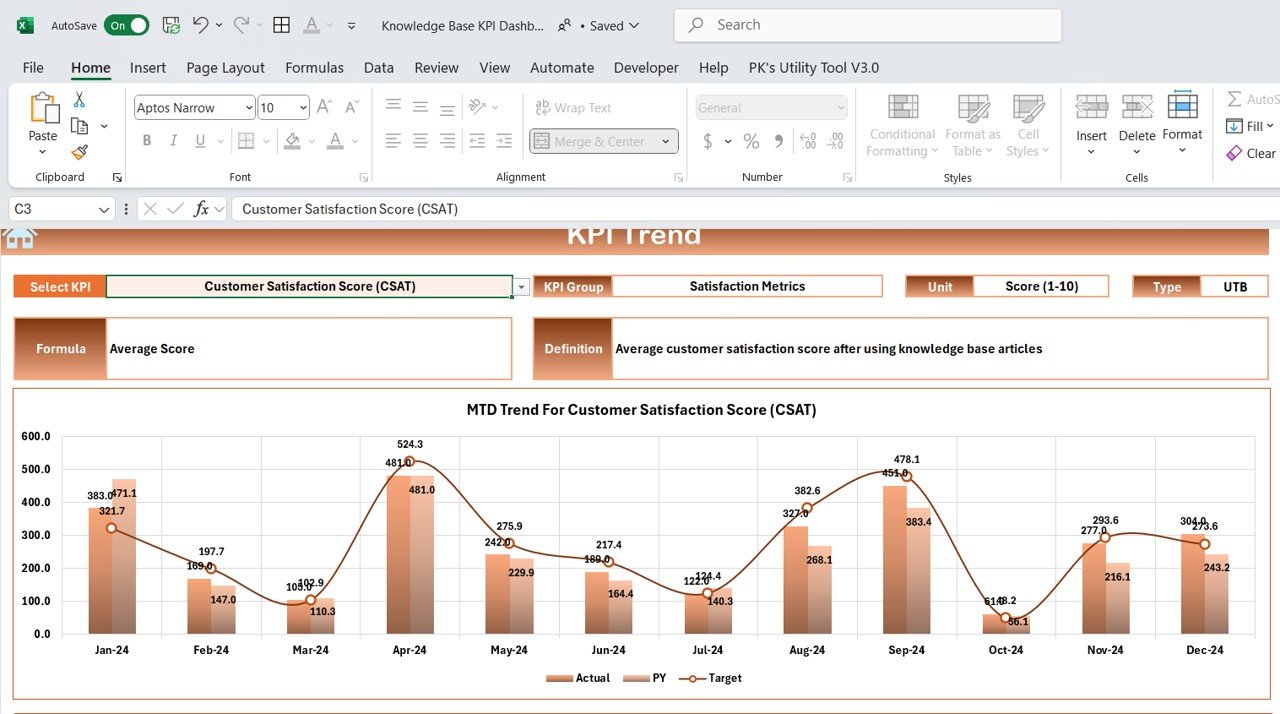
3. KPI Trend Sheet Tab
This sheet allows users to select a specific KPI and analyze its trend over time. The following information is available:
- KPI Group: The category the KPI falls under.
- Unit: The measurement unit of the KPI.
- Type of KPI: Whether it’s “Lower the Better” or “Upper the Better.”
- Formula: The mathematical formula to calculate the KPI.
- Definition: The clear description of what the KPI represents.
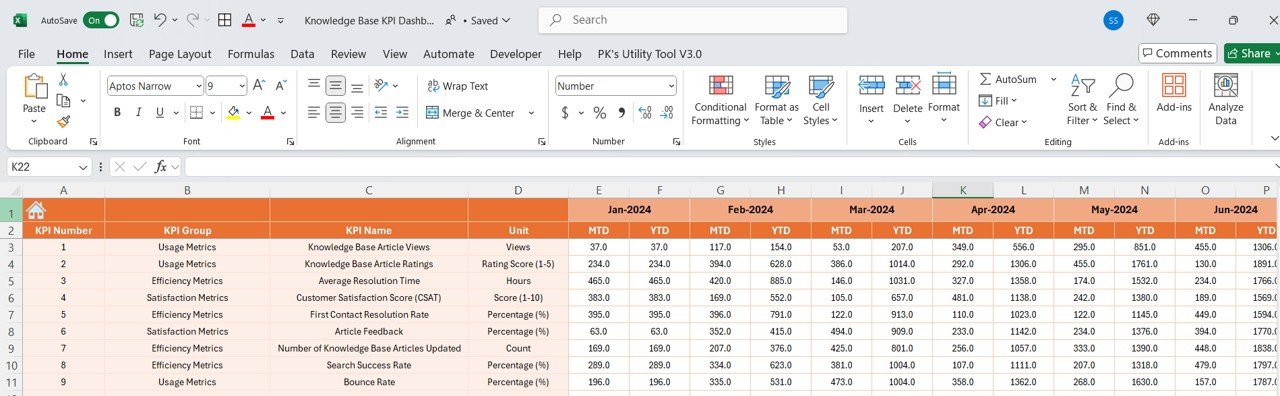
4. Actual Numbers Sheet Tab
This sheet lets you enter the actual number for each KPI on both a monthly and yearly basis. The data is automatically updated based on the selected month, making it easy to track the progress of KPIs throughout the year.
Click to Knowledge Base KPI
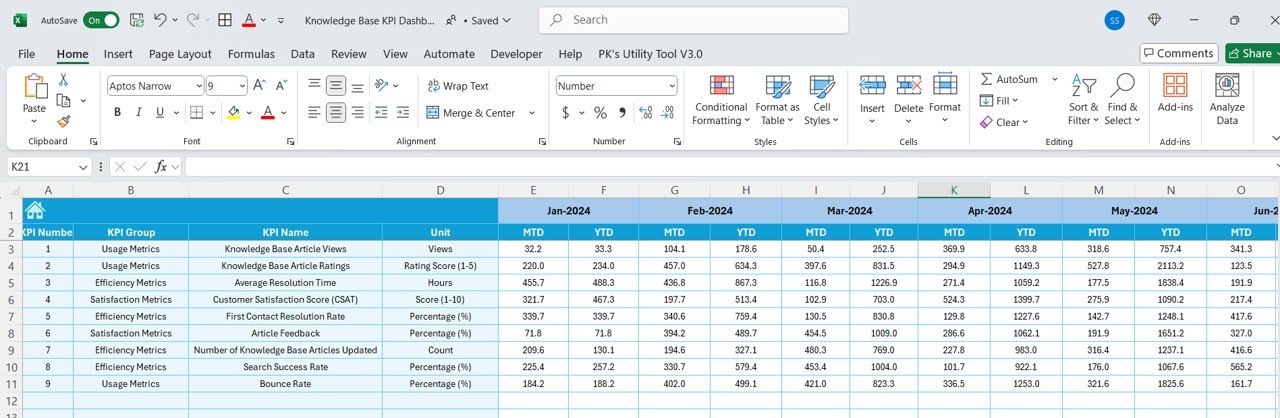
5. Target Sheet Tab
This tab is where you enter the target numbers for each KPI on a monthly and yearly basis. This allows you to track progress against predefined targets and evaluate whether you’re meeting your goals.
Click to Knowledge Base KPI
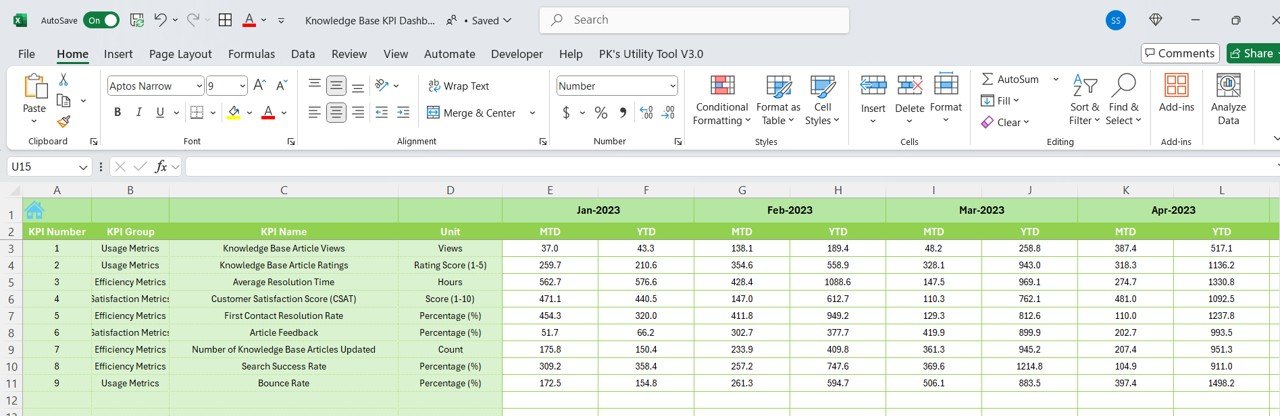
6. Previous Year Numbers Sheet Tab
For comparison, this sheet allows you to enter the previous year’s data for each KPI. This historical data is essential for trend analysis and identifying areas for improvement.
Click to Knowledge Base KPI
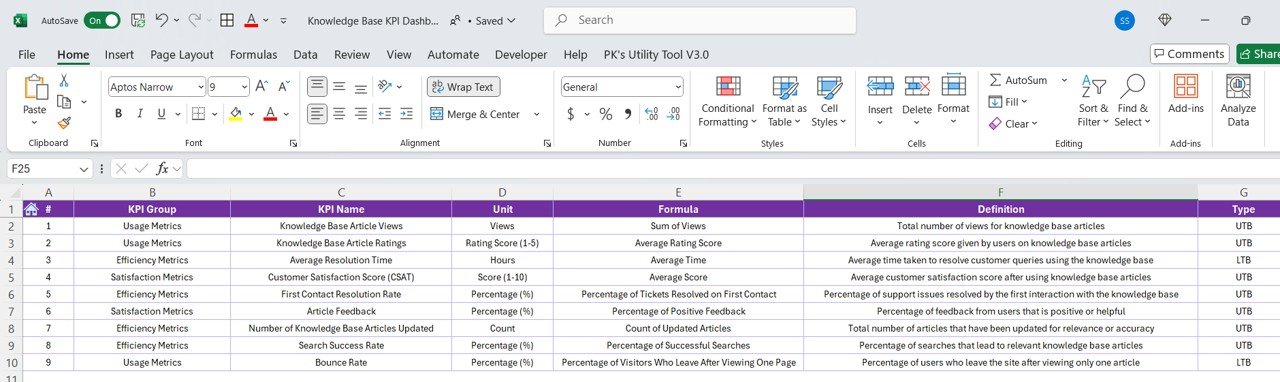
7. KPI Definition Sheet Tab
This sheet allows you to document each KPI’s:
- Name: The KPI’s identifier.
- KPI Group: The category of the KPI.
- Unit: The unit of measurement.
- Formula: The formula used to calculate the KPI.
- Definition: The full explanation of the KPI’s meaning and purpose.
Click to Knowledge Base KPI
Advantages of the Knowledge Base KPI Dashboard
The Knowledge Base KPI Dashboard offers several benefits to organizations looking to optimize their knowledge management systems:
- Real-time Monitoring: It provides up-to-date insights into the performance of your knowledge base, helping you make timely decisions.
- Improved Efficiency: By monitoring KPIs like resolution time and first contact resolution rate, you can identify areas where your team can work more efficiently.
- Better User Experience: KPIs related to customer satisfaction and article ratings help ensure that the content provided is meeting user needs.
- Data-Driven Decisions: The dashboard’s visual representation of KPIs helps you make data-driven decisions that can improve your knowledge base over time.
- Goal Alignment: Setting and tracking targets ensures that everyone on the team is aligned with the organization’s goals.
Opportunities for Improvement in Knowledge Base KPI Dashboard
While the Knowledge Base KPI Dashboard is an invaluable tool, there is always room for improvement:
- Data Integration: The dashboard could benefit from seamless integration with other customer support platforms for real-time data syncing.
- Advanced Analytics: Adding more advanced analytics like sentiment analysis could enhance understanding of customer feedback.
- Customization: While the dashboard is customizable, offering more dynamic customization options could make it even more flexible for different industries.
Best Practices for the Knowledge Base KPI Dashboard
To make the most of your Knowledge Base KPI Dashboard, follow these best practices:
- Regularly Update Your Content: Keep the knowledge base articles up-to-date to maintain high ratings and resolution rates.
- Track KPIs Consistently: Monitor KPIs regularly to ensure that you’re meeting targets and making adjustments when needed.
- Use Conditional Formatting: Leverage conditional formatting (like up/down arrows) to quickly identify performance trends.
- Focus on Customer Feedback: Pay close attention to customer feedback and ratings to improve content quality.
- Ensure Data Accuracy: Accurate data entry is key to obtaining useful insights from the dashboard.
Conclusion
The Knowledge Base KPI Dashboard is an essential tool for any organization looking to optimize its knowledge management system. By tracking and analyzing the right KPIs, you can ensure that your knowledge base is performing at its best, delivering value to both customers and your internal teams. Use the insights gained from this dashboard to continuously improve content, enhance user satisfaction, and streamline processes.
Frequently Asked Questions (FAQ)
1. What KPIs are most important for a Knowledge Base?
Key KPIs include Article Views, Customer Satisfaction Score, Resolution Time, and Search Success Rate. These KPIs help measure the effectiveness of your knowledge base in resolving issues and satisfying customers.
2. How do I update the target values in the Knowledge Base KPI Dashboard?
To update target values, go to the Target Sheet Tab and enter the monthly and yearly targets for each KPI. This will automatically reflect in the dashboard.
3. Can the Knowledge Base KPI Dashboard integrate with other platforms?
While the current version of the dashboard is primarily for manual data entry, future updates could integrate it with other platforms like CRM and customer service tools for real-time data syncing