Are you struggling to track how much knowledge your employees retain after training sessions or continuous learning initiatives? You are not alone. Most organizations want to measure training effectiveness, but very few have a practical tool to monitor and analyze it. That’s where the Knowledge Retention KPI Dashboard in Excel steps in.
In this comprehensive guide, we’ll explore how to use a pre-built Excel dashboard to monitor, analyze, and optimize your knowledge retention KPIs. The best part? You don’t need to be an Excel wizard to use it!
Click to Knowledge Retention KPI
📅 What is a Knowledge Retention KPI Dashboard?
A Knowledge Retention KPI Dashboard is an Excel-based visual tool that helps businesses track how effectively employees retain knowledge over time. It summarizes key performance indicators (KPIs) related to training outcomes, offering monthly and yearly comparisons in one easy-to-use platform.
This dashboard provides insights like:
- Month-to-Date (MTD) actual vs. target vs. previous year performance
- Year-to-Date (YTD) data comparisons
- KPI trends and definitions
- Easy input and update options
- Whether you manage HR, L&D, or a corporate training program, this dashboard brings clarity and actionability to your data.
Key Components of the Knowledge Retention KPI Dashboard
This Excel dashboard consists of 7 powerful worksheets, each designed for a specific purpose. Let’s walk through them.
“Home” Sheet – Your Control Center
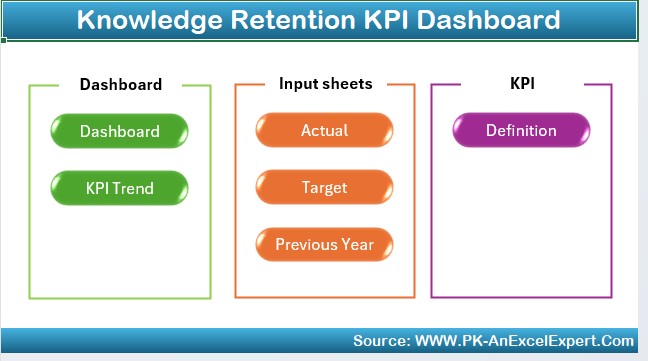
This is your starting point. The Home sheet acts like a central index from where you can navigate to any of the other six sheets using intuitive buttons. Think of it as the main menu of your dashboard.
6 buttons for instant access
- Clean layout and design
- Saves time while navigating large files
Click to Knowledge Retention KPI
Dashboard Sheet – The Main Hub
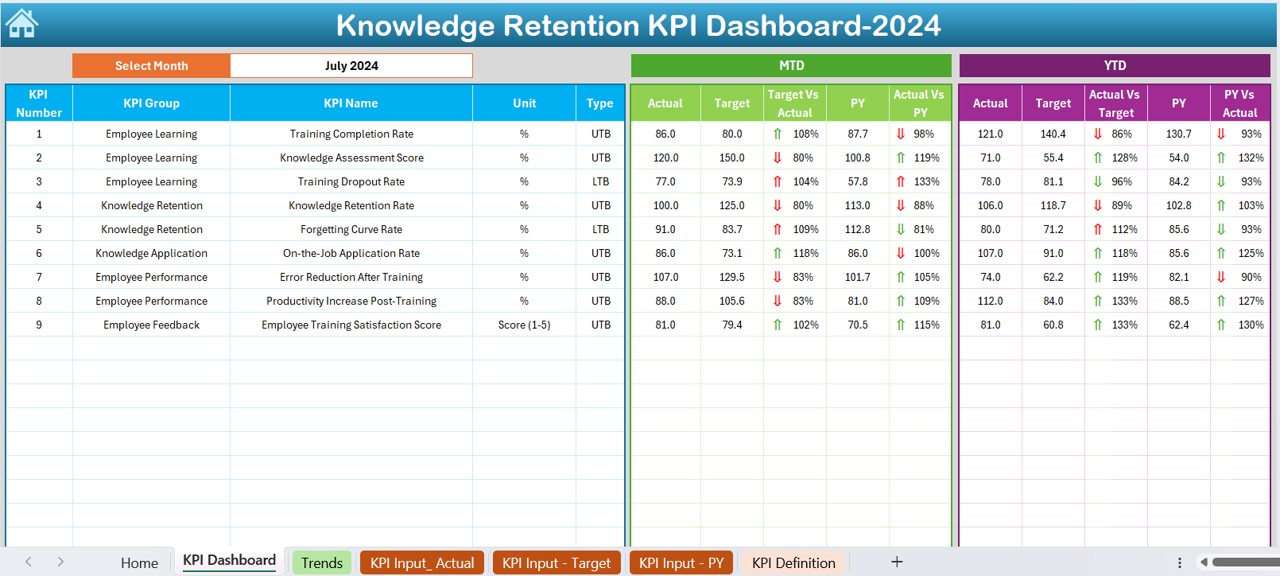
This is where the magic happens. The Dashboard sheet presents a full view of your Knowledge Retention KPIs.
Main Features:
- A drop-down menu to select the month (cell D3)
- MTD Actual, Target, and Previous Year data
- YTD Actual, Target, and Previous Year data
- Conditional formatting with up/down arrows to show improvements or declines
- You can instantly assess whether your team is progressing, staying stagnant, or falling behind in retaining key knowledge.
KPI Trend Sheet – Visualize the Progress
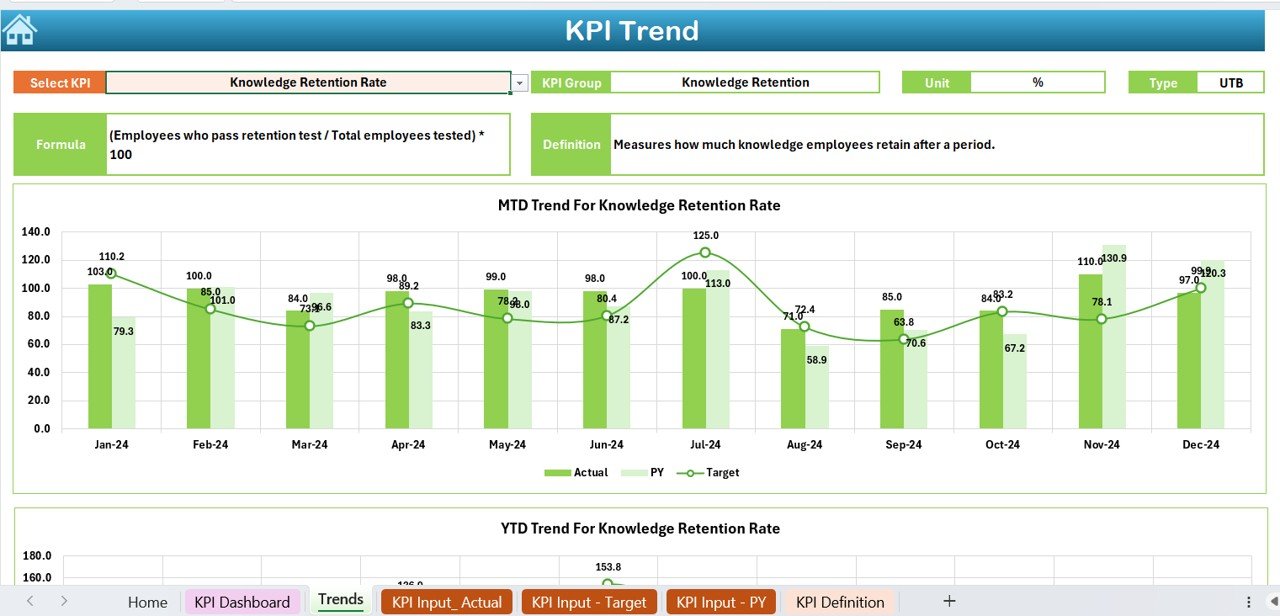
- This sheet offers a deep dive into individual KPIs. Once you select a KPI from the drop-down in cell C3, you’ll see:
- KPI Group
- Unit of measurement
- KPI type (e.g., “Higher is better”)
- Formula
- Definition
It also features clear MTD and YTD trend charts, helping you spot patterns and take timely action.
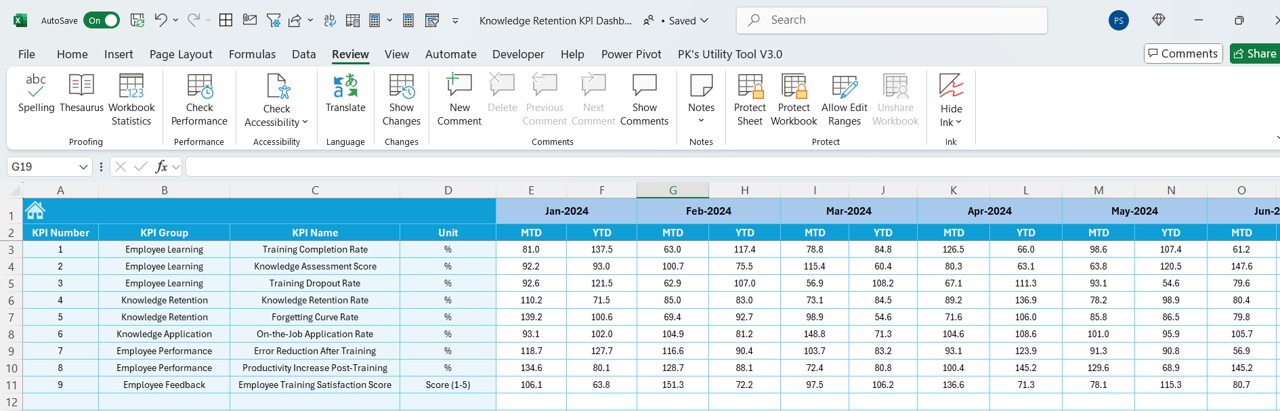
Actual Numbers Input Sheet – Easy Data Entry
- Keep your data up to date effortlessly. This sheet allows you to input actual values for each KPI, month by month.
- Simply set the first month of the year in cell E1
- Input MTD and YTD actuals
- Simple structure and layout
Click to Knowledge Retention KPI
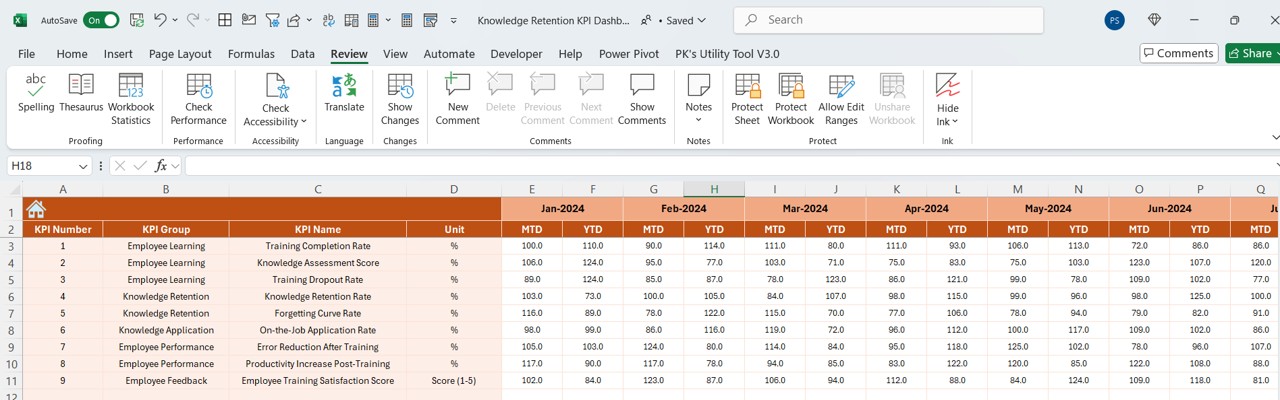
Target Sheet – Define Your Goals
- Use this tab to enter your target values for each KPI.
- Monthly (MTD) and Yearly (YTD) targets
- Aligns everyone with business expectations
- Helps in performance benchmarking
Previous Year Sheet – Compare with the Past
- Looking back helps you move forward. This sheet allows you to enter last year’s values for each KPI.
- Useful for YoY comparison
- Helps track learning program improvement
KPI Definition Sheet – Know What You Measure
Each KPI needs a solid foundation. This sheet lets you define each one clearly:
- KPI Name
- Group
- Unit
- Formula
- Detailed description
This is critical for avoiding confusion and keeping all team members on the same page.
Click to Knowledge Retention KPI
Advantages of the Knowledge Retention KPI Dashboard in Excel
✅ Easy to Use: You don’t need advanced Excel knowledge. Drop-downs, input boxes, and clear navigation make it beginner-friendly.
✅ Saves Time: Instead of juggling multiple files or spreadsheets, get everything in one place. Just a few clicks and you’re ready.
✅ Boosts Accountability: When KPIs are visible and tracked regularly, employees and departments become more accountable for training outcomes.
✅ Helps in Strategic Decisions: With trend charts and YTD comparisons, you get the data needed to improve training programs.
✅ Customizable: Change KPIs, formulas, or visuals to suit your specific organization’s needs.
Best Practices for Using the Knowledge Retention KPI Dashboard
- Keep Your Data Updated: Input actuals, targets, and past values regularly to maintain accuracy.
- Review Monthly: Use the drop-down to assess performance every month. Spot red flags early.
- Define KPIs Clearly: Update the KPI Definition sheet with terms that everyone understands.
- Align KPIs with Training Goals: Only track what truly matters. Choose KPIs that reflect real learning impact.
- Communicate Findings: Share dashboard insights with trainers, managers, and teams. Data should drive discussion.
Why Should You Use Excel for Knowledge Retention KPIs?
- Excel offers unmatched flexibility, especially when paired with dashboard elements. Here’s why it makes sense:
- No additional software needed
- Easy to share via email or cloud
- Secure and editable
- Tailorable for any organization
- Whether you are a small business or a large enterprise, Excel gives you a low-cost yet powerful tool.
How to Get Started with This Excel Dashboard?
- It’s simple!
- Download the template.
- Start with the KPI Definition sheet to list all your KPIs.
- Enter target values and last year’s data.
- Begin monthly updates in the Actual Numbers Input sheet.
- Use the Dashboard and Trend sheets to monitor performance.
When to Use This Dashboard?
- Use it throughout the year to:
- Track onboarding program effectiveness
- Monitor training sessions for various departments
- Compare learning outcomes YoY
- Identify weak retention areas
Who Can Use the Knowledge Retention KPI Dashboard?
- HR Professionals to evaluate the success of L&D initiatives
- Learning & Development Teams to adjust training content
- Team Leads and Managers to track knowledge gaps
- Executives to align workforce learning with company goals
Conclusion
The Knowledge Retention KPI Dashboard in Excel is more than a tracking tool. It helps organizations make smarter, data-driven decisions around training and development. You get clarity, control, and the ability to drive continuous improvement.
Frequently Asked Questions (FAQs)
What is knowledge retention in the workplace?
Knowledge retention measures how much information an employee retains after training or learning experiences.
Can I customize this Excel template?
Absolutely. You can add or remove KPIs, adjust visuals, and tailor it to your company’s specific requirements.
Do I need advanced Excel skills to use this dashboard?
No. The template uses drop-downs, input cells, and pre-built formulas. It’s beginner-friendly.
How often should I update the data?
It’s best to update the dashboard monthly to keep insights fresh and actionable.
Is it possible to use this for other departments too?
Yes. While this version focuses on knowledge retention, you can modify it to track other KPIs like productivity, engagement, etc.
How many KPIs can I track?
You can track as many as your worksheet structure allows. Most teams find 5 to 15 KPIs manageable and effective.
Can I share this dashboard with my team?
Yes. Since it’s Excel-based, you can easily email or upload it to a shared drive for team access.
Click to Knowledge Retention KPI
Visit our YouTube channel to learn step-by-step video tutorials