In today’s fast-paced business world, leadership development is crucial for organizational success. Companies need to track the progress of leadership training programs, measure the impact of leadership initiatives, and assess key performance indicators (KPIs) to ensure continuous improvement.
An Excel-based Leadership Development KPI Dashboard provides a comprehensive, data-driven approach to monitoring and evaluating leadership growth. With this dashboard, businesses can track essential leadership metrics, compare current performance with targets, and make informed decisions.
In this guide, we’ll explore the Leadership Development KPI Dashboard in Excel, its features, advantages, best practices, and frequently asked questions.
Click to Leadership Development KPI
What is a Leadership Development KPI Dashboard?
A Leadership Development KPI Dashboard is a structured tool used to measure and analyze leadership effectiveness within an organization. It provides visual insights into key leadership KPIs, such as employee engagement, retention, leadership training effectiveness, and team performance.
By utilizing this Excel dashboard, HR professionals, business leaders, and training managers can track leadership development progress efficiently and make data-backed decisions to improve leadership training initiatives.
Key Features of the Leadership Development KPI Dashboard
This ready-to-use Excel template includes seven worksheets, each designed to simplify tracking and evaluation. Let’s dive into its components:
Home Sheet
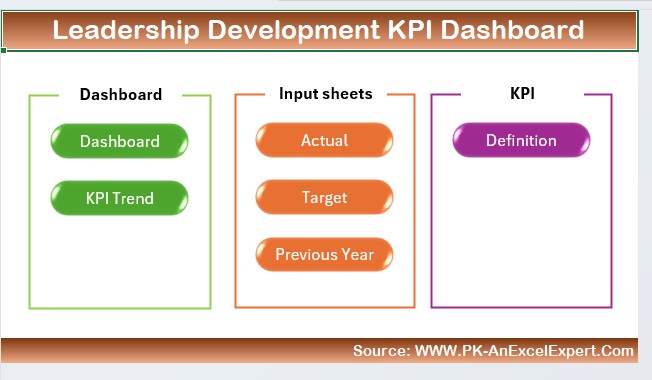
- Acts as an index page with six navigation buttons for quick access to different sheets.
- Ensures easy navigation between various KPI sections.
- Provides an overview of the dashboard structure.
Click to Leadership Development KPI
Dashboard Sheet Tab
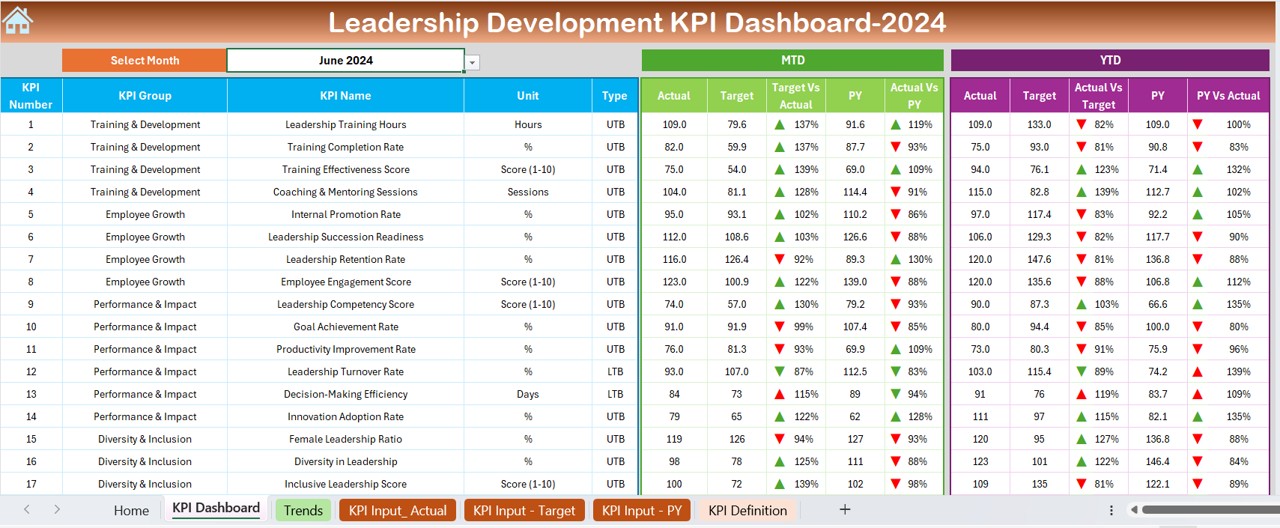
The main visualization hub displaying all leadership KPIs.
- Allows users to select the month from a dropdown in D3, updating the entire dashboard for that period.
- Showcases MTD (Month-to-Date) and YTD (Year-to-Date) data, including:
- Actual values
- Target values
- Previous Year’s data
- Target vs. Actual with conditional formatting (up/down arrows for quick insights).
- PY vs. Actual comparison with conditional formatting.
- Helps stakeholders analyze leadership performance trends quickly.
KPI Trend Sheet Tab
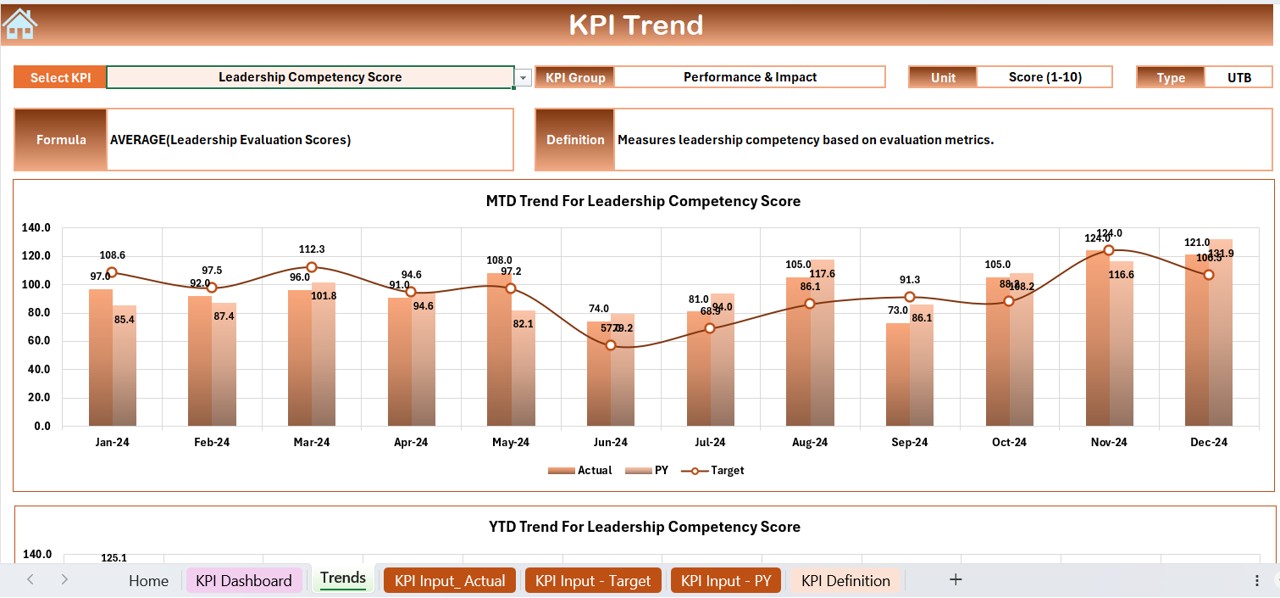
Users can select any KPI name using a dropdown in C3.
Displays:
- KPI Group (e.g., Leadership Training, Employee Engagement, Performance Management)
- KPI Unit (e.g., Percentage, Absolute Count)
- KPI Type (Lower is Better or Higher is Better)
- Formula used for KPI calculations.
- Definition explaining each KPI.
- Includes MTD and YTD trend charts for better data visualization.
Click to Leadership Development KPI
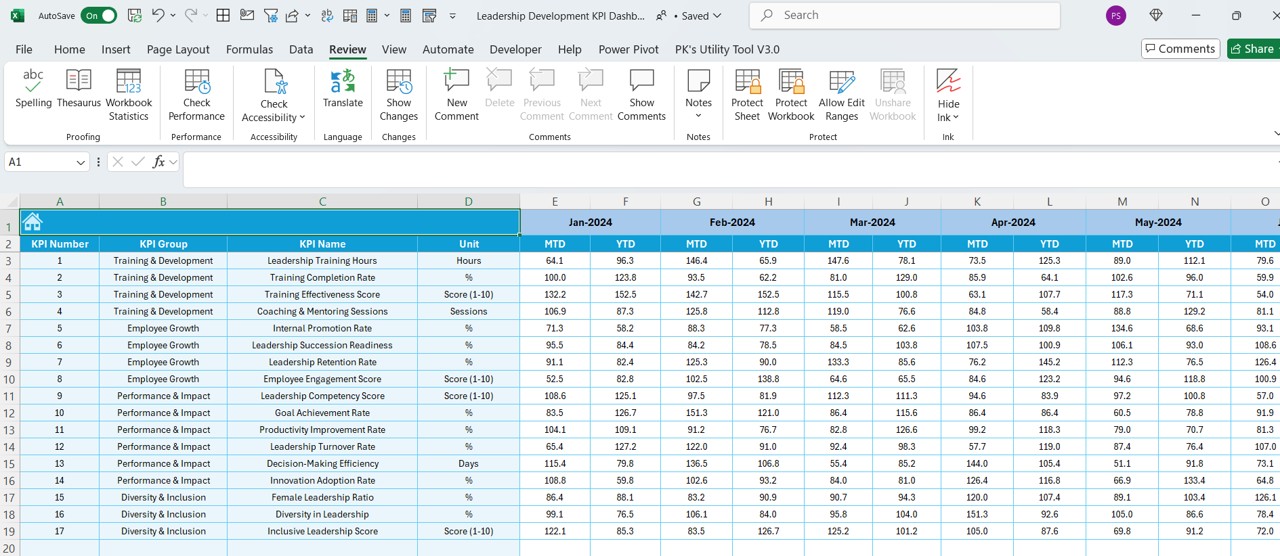
Actual Numbers Input Sheet
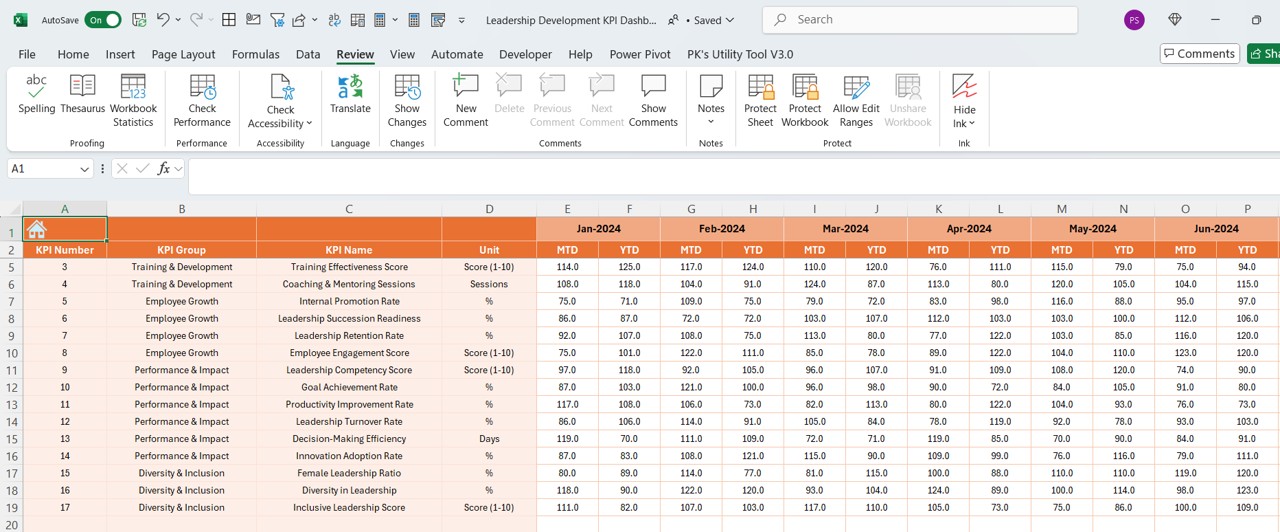
- Used to enter actual KPI values for MTD and YTD.
- The month can be adjusted in E1, updating all relevant fields.
- Allows historical data entry for effective performance comparisons.
Target Sheet Tab
- Enables organizations to set monthly KPI targets.
- Users input MTD and YTD targets for each KPI.
- Ensures clear goal setting and progress tracking.
Previous Year Numbers Sheet Tab
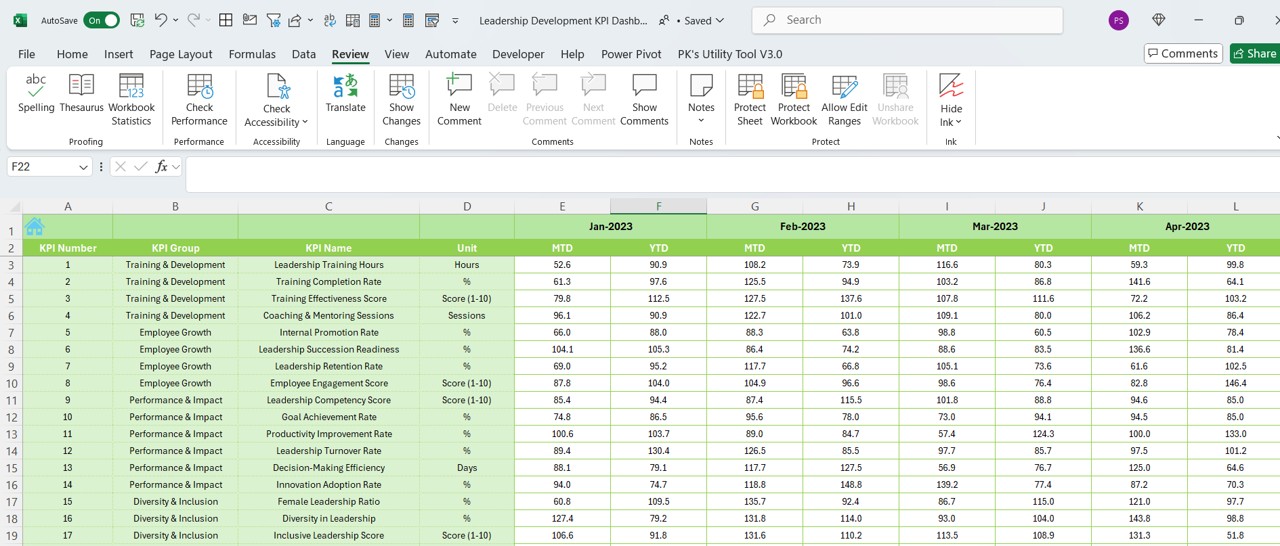
- Stores previous year’s KPI values.
- Facilitates year-over-year performance comparisons.
- Helps in benchmarking progress over time.
Click to Leadership Development KPI
KPI Definition Sheet Tab
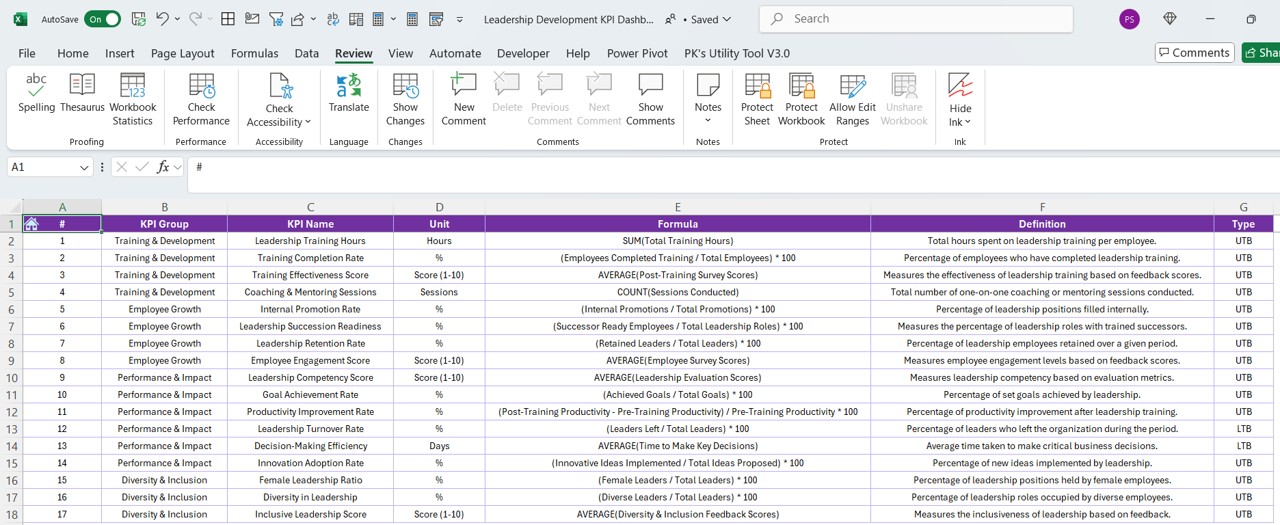
- Contains KPI metadata, including:
- KPI Name
- KPI Group
- Unit
- Formula
- Detailed KPI Definition
- Acts as a reference sheet for understanding leadership KPIs.
Advantages of Using a Leadership Development KPI Dashboard
Using this Leadership Development KPI Dashboard in Excel offers numerous benefits, including:
- Data-Driven Decision Making: Provides real-time insights into leadership progress.
- Performance Tracking: Compares MTD and YTD performance against targets and previous year values.
- Improved Accountability: Encourages leaders to stay on track with their development goals.
- Enhanced Visualization: Uses charts and conditional formatting for clear analysis.
- Easy Customization: Users can modify KPIs based on organizational needs.
- Time Efficiency: Eliminates manual tracking and streamlines reporting.
Best Practices for Using the Leadership Development KPI Dashboard
To maximize the effectiveness of this dashboard, follow these best practices:
Define Clear Leadership KPIs
- Identify specific, measurable KPIs relevant to leadership growth.
- Examples include leadership training completion rates, team productivity, and employee retention.
Update Data Regularly
- Ensure monthly and yearly updates for accurate reporting.
- Use automation features in Excel to reduce manual entry errors.
Use Conditional Formatting
- Utilize color coding (e.g., red for underperformance, green for meeting/exceeding targets).
- Helps in quick data interpretation.
Leverage Trend Analysis
- Compare MTD vs. YTD values to identify performance patterns.
- Spot areas where additional training or support may be required.
Encourage Leadership Accountability
- Share dashboard insights with management teams.
- Set realistic yet challenging targets to motivate continuous improvement.
Conclusion
The Leadership Development KPI Dashboard in Excel is a powerful tool for tracking and enhancing leadership capabilities within an organization. By leveraging structured KPI tracking, real-time data updates, and trend analysis, businesses can ensure continuous leadership growth and effectiveness.
Frequently Asked Questions (FAQs)
What are the key KPIs for leadership development?
- Some essential Leadership Development KPIs include:
- Employee Engagement Score
- Training Completion Rate
- Leadership Retention Rate
- Performance Review Ratings
- Team Productivity Metrics
How does this Excel dashboard help organizations?
This dashboard provides real-time insights into leadership effectiveness, compares performance trends, and enables data-driven decision-making to improve leadership programs.
Can I customize the KPI Dashboard based on my needs?
Yes! This Excel-based dashboard is fully customizable, allowing users to modify KPIs, formulas, and visualization elements as per their business requirements.
How frequently should I update the dashboard?
It is recommended to update KPI data monthly to ensure accurate reporting and analysis.
Visit our YouTube channel to learn step-by-step video tutorials
View this post on Instagram