Managing a loan portfolio can be a complex task, but having a well-structured KPI dashboard in Excel makes it much easier. This tool helps financial institutions and lenders keep track of key performance indicators (KPIs) efficiently. With the right dashboard, you can monitor loan trends, measure performance, and ensure that your financial strategies are on the right track.
In this guide, we will explore how to create and use a Loan Portfolio KPI Dashboard in Excel to make loan management smoother and more effective.
Click to Loan Portfolio KPI
Why Should You Use a Loan Portfolio KPI Dashboard?
A Loan Portfolio KPI Dashboard is essential for keeping an eye on loan-related metrics in one place. It enables quick and informed decision-making, reducing financial risks. Here are some compelling reasons to use this dashboard:
- Monitor Performance in Real-Time – Stay updated on how your loan portfolio is performing.
- Make Data-Driven Decisions – Gain insights that help you improve financial strategies.
- Assess Financial Stability – Identify risks before they become major issues.
- Compare Actual Performance Against Targets – Keep track of how well you are meeting goals.
- Reduce Manual Work – Automate calculations and updates to save time.
Click to Loan Portfolio KPI
Key Features of the Loan Portfolio KPI Dashboard
This Excel template is designed for ease of use and consists of seven different worksheets, each with a specific role.
Home Sheet
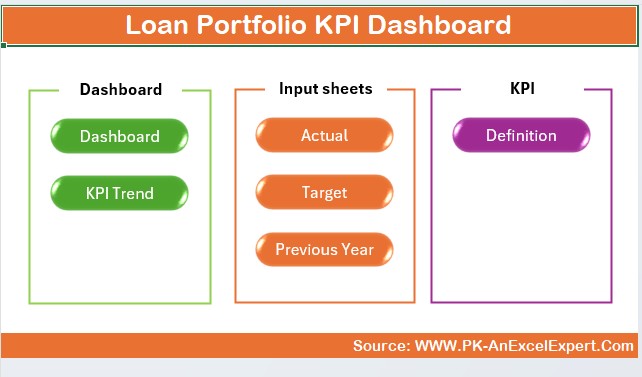
- Acts as the main menu with clickable buttons to navigate to different sections.
- Provides a quick and easy way to access essential data.
Click to Loan Portfolio KPI
Dashboard Sheet
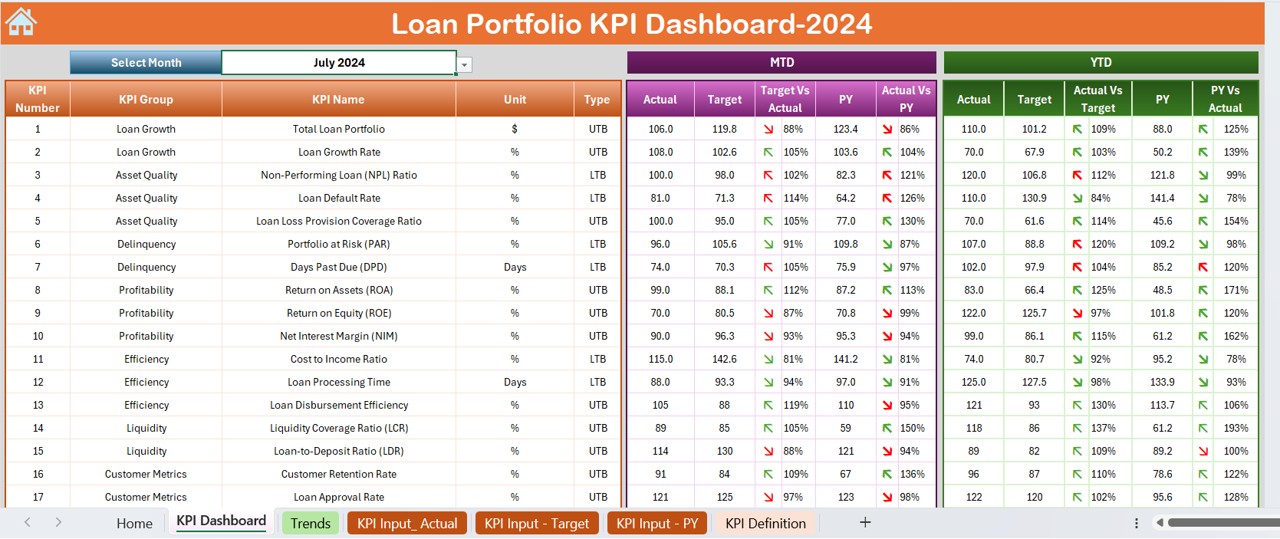
- The main display where all KPIs are presented.
- Allows users to select a month from a drop-down menu (Cell D3) to view relevant data.
Displays:
- MTD (Month-to-Date) and YTD (Year-to-Date) values
- Actual, Target, and Previous Year Data
- Comparison between Target vs. Actual and Previous Year vs. Actual
- Conditional formatting with Up/Down arrows to highlight trends
KPI Trend Sheet
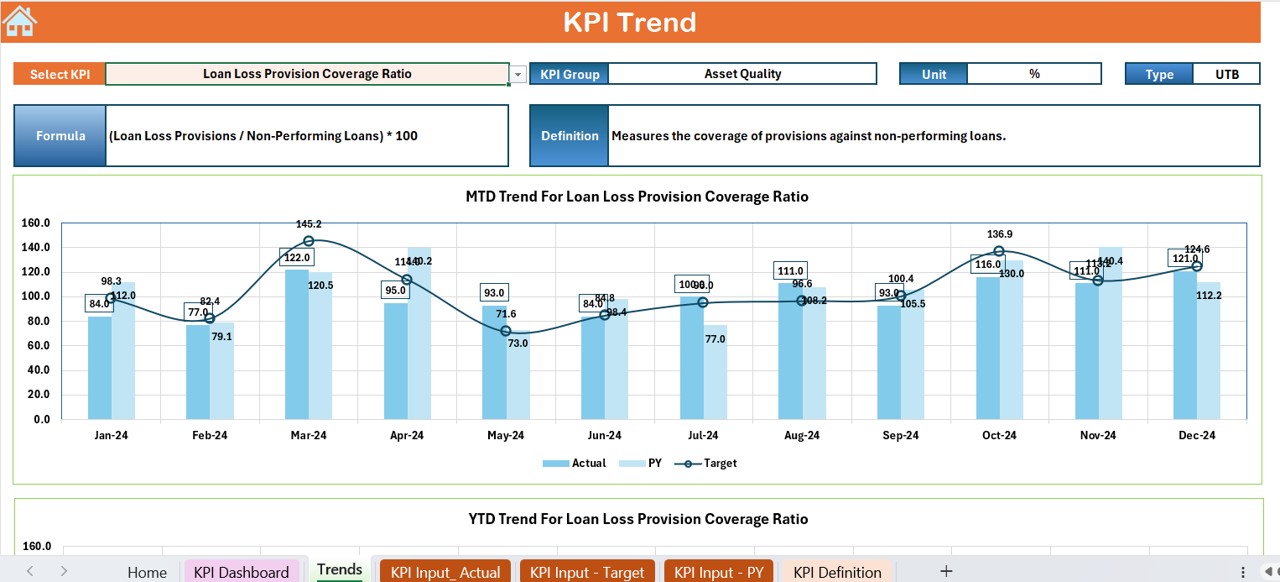
- Enables users to select a KPI from a drop-down list (Cell C3) to see detailed trends.
- Displays important information such as:
- KPI Group
- Unit of Measurement
- Performance Type (Lower is Better / Upper is Better)
- Formula and Definition of the KPI
- Visualizes MTD and YTD trend charts for a better understanding.
Click to Loan Portfolio KPI
Actual Numbers Input Sheet
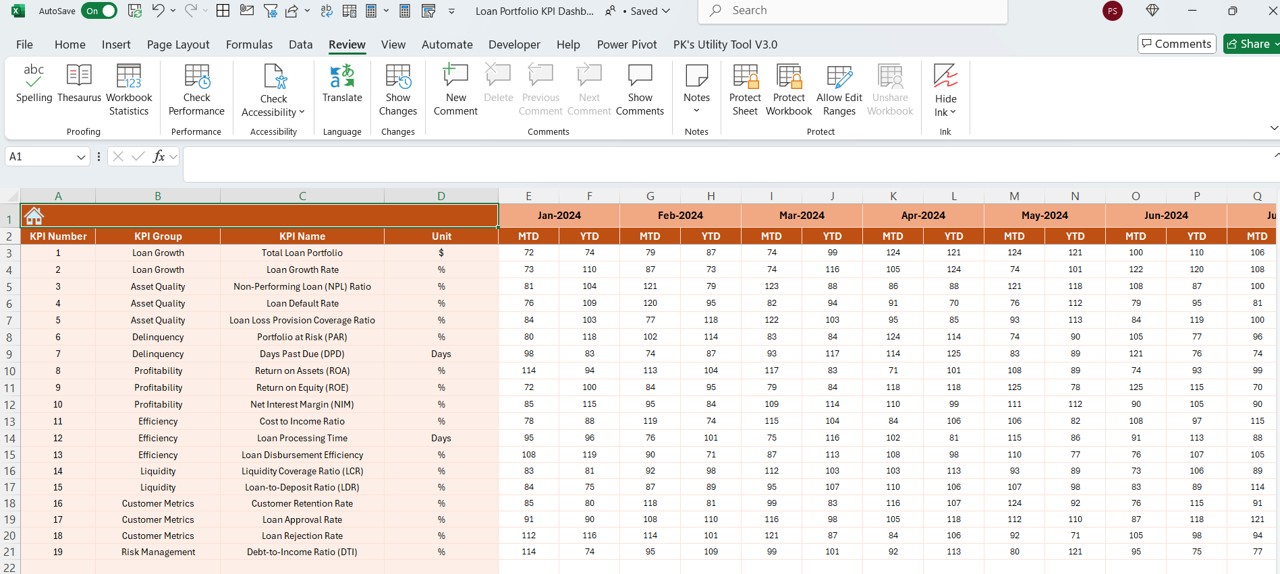
- Users enter actual performance figures for MTD and YTD.
- The month can be adjusted by modifying Cell E1.
- Helps maintain accurate records for tracking purposes.
Target Sheet

- Users input target values for each KPI.
- Ensures that both MTD and YTD targets are available for comparison.
Previous Year Numbers Sheet

- Stores previous year’s actual values.
- Helps compare historical data for performance evaluation.
Click to Loan Portfolio KPI
KPI Definition Sheet

- Provides a structured section to define each KPI, including:
- KPI Name & Group
- Unit of Measurement
- Formula for Calculation
- KPI Definition
Why This Dashboard is Useful
Better Loan Management
- Gives a clear picture of loan performance and trends.
- Helps detect delinquent loans before they become a problem.
Automates Data Analysis
- Reduces human errors and saves time.
- Automatically updates performance charts and indicators.
Fully Customizable
- Users can add new KPIs or modify existing ones.
- Works well for different types of financial organizations.
Enhances Decision-Making
- Provides real-time insights to support strategic planning.
- Helps optimize loan management policies.
Best Practices for Using the Loan Portfolio KPI Dashboard
Keep Data Up-to-Date
- Regularly update actual numbers.
- Ensure target values align with financial goals.
Use Conditional Formatting for Quick Analysis
- Highlight negative performance with red markers.
- Emphasize positive trends with green indicators.
Review Trends Every Month
- Compare MTD and YTD performance on a regular basis.
- Adjust loan strategies based on data-driven insights.
Modify KPIs to Fit Business Needs
- Update KPI formulas when needed.
- Add or remove KPIs based on evolving business requirements.
Click to Loan Portfolio KPI
Conclusion
The Loan Portfolio KPI Dashboard in Excel is a powerful tool that helps financial institutions stay on top of their loan management game. It simplifies monitoring, enhances decision-making, and provides a clear view of financial health. By keeping the data updated and using best practices, businesses can make more informed and effective financial decisions.
Frequently Asked Questions (FAQs)
What is a Loan Portfolio KPI Dashboard?
A Loan Portfolio KPI Dashboard is an Excel tool designed to track and analyze key financial metrics related to a loan portfolio. It helps financial institutions monitor performance and optimize strategies.
Can I customize the Loan Portfolio KPI Dashboard?
Yes, you can modify the KPIs, update formulas, and add new data fields as needed. The KPI Definition Sheet allows you to tailor it to your specific business requirements.
How often should I update the dashboard?
It is best to update it monthly by entering the latest actual figures. This ensures that trends and performance indicators are accurate.
Can this dashboard be used for personal finance tracking?
While it is designed for professional loan portfolio management, you can adapt it to track personal loans, mortgages, or other credit-related accounts.
What are some essential KPIs to track in a Loan Portfolio Dashboard?
- Some crucial KPIs include:
- Loan Default Rate
- Portfolio Yield
- Loan Approval Rate
- Average Loan Tenure
- Net Interest Margin
Click to Loan Portfolio KPI
Visit our YouTube channel to learn step-by-step video tutorials
View this post on Instagram