Managing logistics costs effectively is vital for the efficiency and profitability of any organization involved in the supply chain. An Excel-based Key Performance Indicator (KPI) Dashboard dedicated to logistics cost optimization not only simplifies tracking but also enhances decision-making by providing real-time data insights. This article explores the creation and utilization of a Logistics Cost Optimization KPI Dashboard in Excel, detailing its features, advantages, and best practices for maximal benefit.
Click to buy Logistics Cost Optimization KPI Dashboard in Excel
What is a Logistics Cost Optimization KPI Dashboard?
A Logistics Cost Optimization KPI Dashboard in Excel is a sophisticated tool designed to monitor, analyze, and optimize the expenses associated with logistics activities. It aggregates various key performance indicators to give stakeholders a clear view of operational performance against set financial targets.
Key Features of the Logistics Cost Optimization KPI Dashboard
Home Sheet (Index and Navigation)
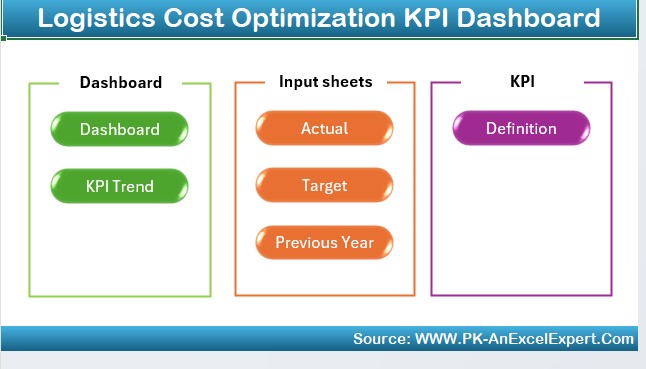
- Overview: Serves as the central hub for navigation, featuring buttons that instantly take you to other sections of the dashboard.
Click to buy Logistics Cost Optimization KPI Dashboard in Excel
Dashboard Sheet Tab (Core Analysis)
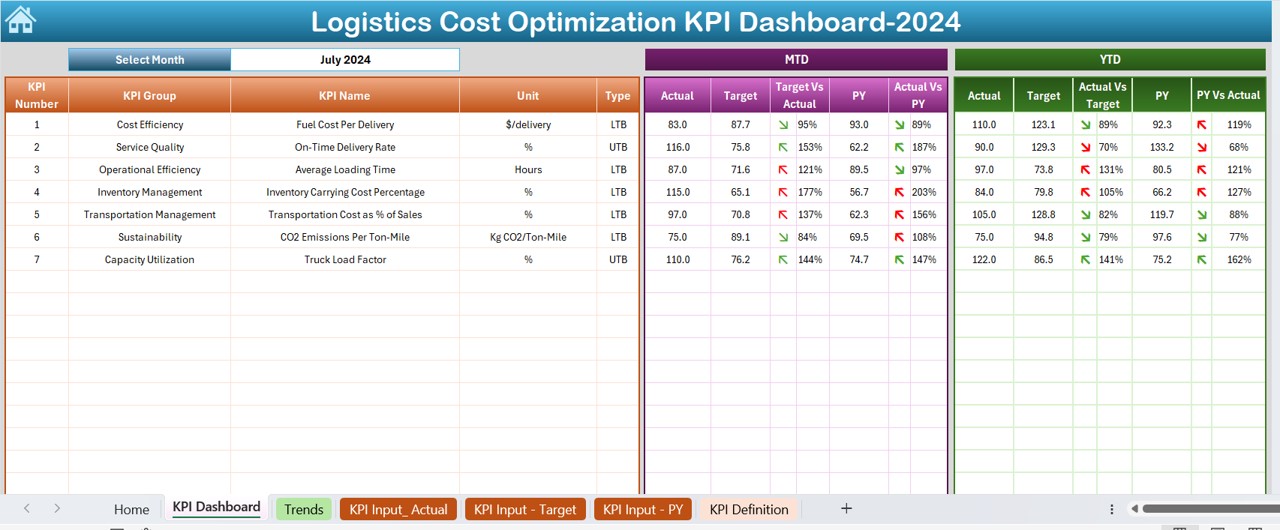
- Functionality: Displays comprehensive logistics KPI data for selected months, with dynamic content updates upon month selection from a drop-down menu.
- Visualization: Includes visual trends and comparisons of Month-to-Date (MTD) and Year-to-Date (YTD) actuals vs. targets, alongside previous year’s data, enhanced with conditional formatting arrows indicating performance direction.
KPI Trend Sheet Tab (Trend Analysis)
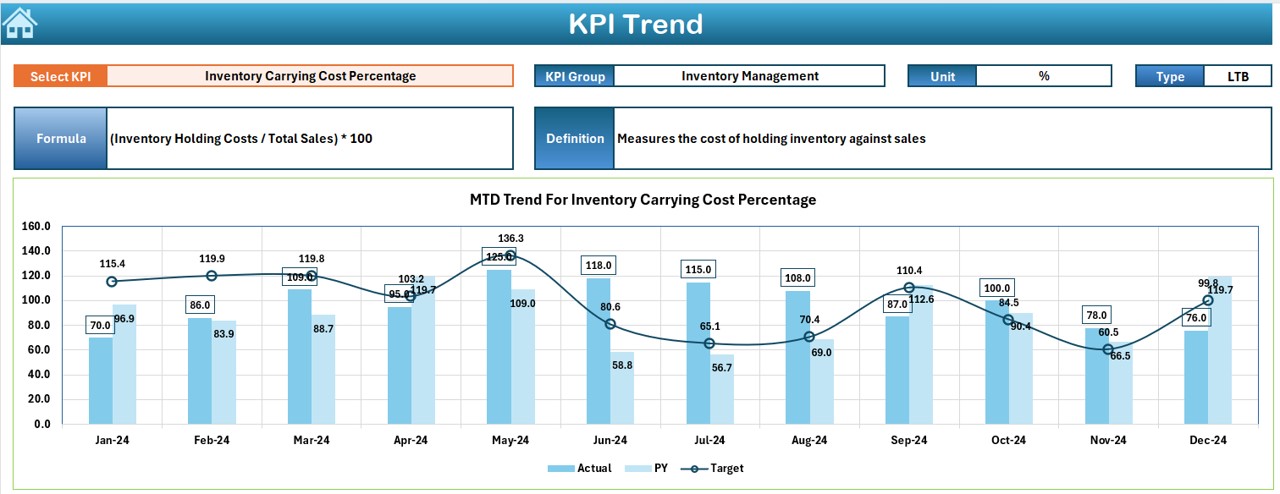
- Selection and Display: Allows for the selection of specific KPIs to view detailed trends over time, showing comparisons across actual figures, targets, and previous year metrics.
Actual Numbers Input Sheet (Data Entry)
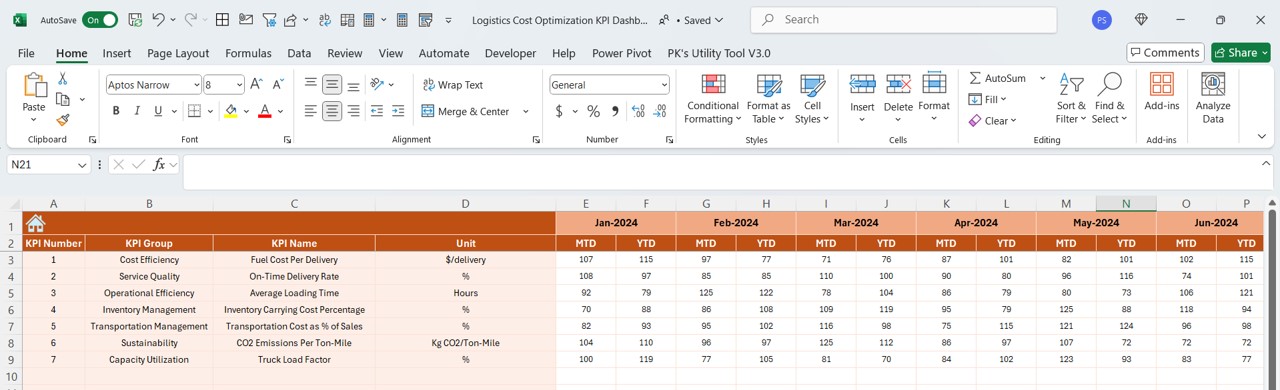
- Data Management: Facilitates the entry of actual logistics costs, both MTD and YTD, adjustable by changing the month in a designated range.
Target Sheet Tab (Target Setting)
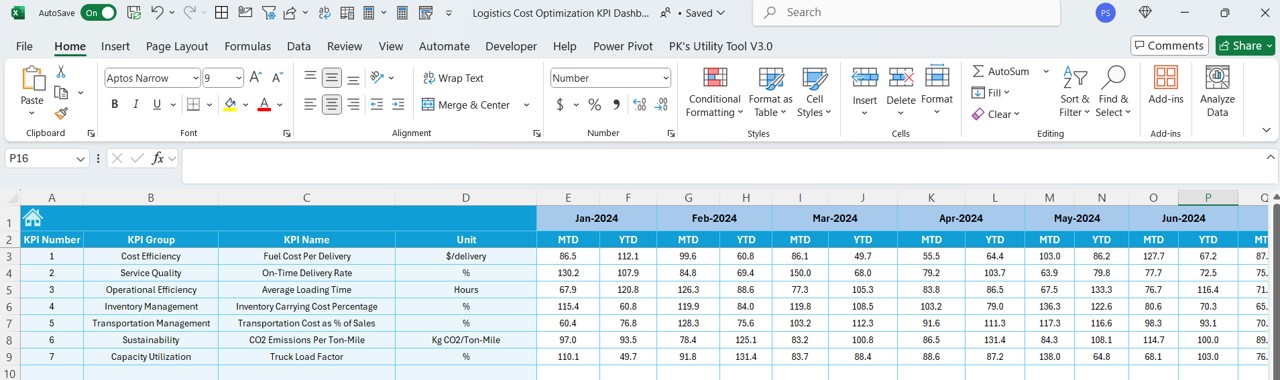
- Planning Tool: Used for entering monthly and annual target figures for each KPI, essential for performance tracking.
Previous Year Number Sheet Tab (Historical Data Comparison)
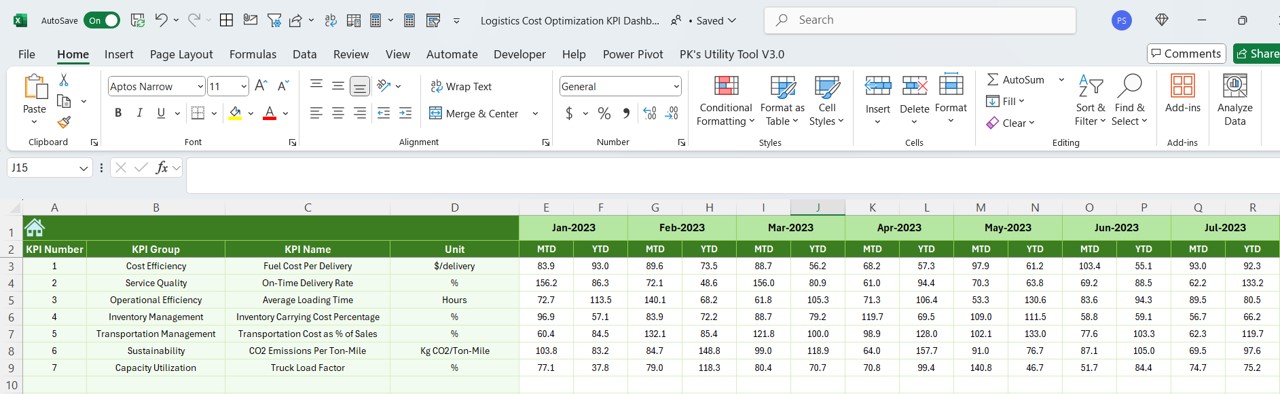
- Historical Insight: Helps in entering and comparing past year’s data to current year’s performance to gauge trends and improvements.
Click to buy Logistics Cost Optimization KPI Dashboard in Excel
KPI Definition Sheet Tab (Reference Material)
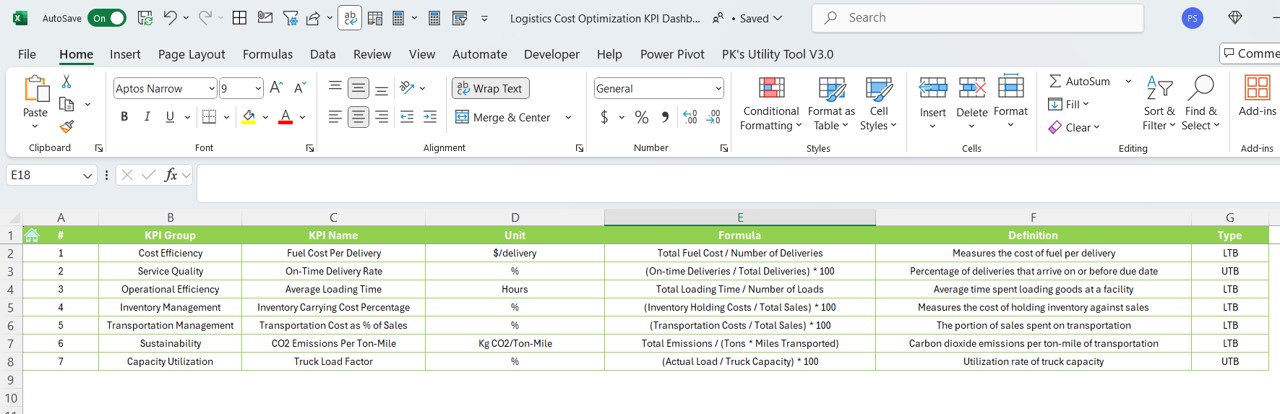
- Resource: Provides a detailed description of each KPI, including its group, unit, formula, and operational definition, serving as a reference point for users.
Advantages of Using a Logistics Cost Optimization KPI Dashboard
- Enhanced Decision Making: Quick access to logistics performance data helps in making informed decisions that can significantly reduce costs and improve efficiency.
- Real-time Performance Tracking: Immediate updates mean that data is always current, allowing for swift action in response to any deviations from targets.
- Increased Visibility: Stakeholders gain a comprehensive overview of logistics operations, aiding in better control and management of resources.
- Strategic Planning Support: Historical data comparison facilitates trend analysis and aids in more accurate forecasting and budgeting.
Click to buy Logistics Cost Optimization KPI Dashboard in Excel
Best Practices for Using a Logistics Cost Optimization KPI Dashboard
- Regular Data Updates: Ensure that the input sheets are regularly updated with the latest data to maintain accuracy in tracking and analysis.
- Customization and Scalability: Adapt the dashboard to meet specific organizational needs and scale it as operations expand.
- Training and Usability: Provide adequate training for all users to maximize the dashboard’s effectiveness and ensure that it is user-friendly.
- Security Measures: Implement appropriate security measures to protect sensitive data from unauthorized access.
Conclusion
Implementing a Logistics Cost Optimization KPI Dashboard in Excel can transform how an organization tracks and controls its logistics costs. By leveraging the real-time data and analytics provided by the dashboard, businesses can enhance operational efficiency, reduce costs, and ultimately boost profitability.
Frequently Asked Questions
Q. How often should the KPI dashboard be updated?
Ideally, the dashboard should be updated with new data as soon as it becomes available, typically at the end of each accounting period.
Q. Can the dashboard be customized for different logistic models?
Yes, the dashboard is highly customizable to cater to various logistic operations and models.
Q. What are the common challenges in maintaining a KPI dashboard?
Common challenges include data inconsistency, lack of user training, and the need for regular updates to maintain dashboard accuracy.
Q. How does conditional formatting help in the dashboard?
Conditional formatting visually distinguishes performance metrics, such as targets met or missed, facilitating quicker assessment and decision-making.
Click to buy Logistics Cost Optimization KPI Dashboard in Excel
Visit our YouTube channel to learn step-by-step video tutorials
View this post on Instagram
Click to buy Logistics Cost Optimization KPI Dashboard in Excel