Managing manufacturing data can feel overwhelming, especially when there are multiple plants, categories, products, and supervisors to monitor. That’s where a Manufacturing Dashboard in Excel becomes your go-to solution. This powerful, user-friendly dashboard offers real-time insights into production, cost, revenue, defects, and efficiency—all at your fingertips. Whether you’re a factory supervisor or a financial analyst, this tool helps you track performance without getting buried in spreadsheets.
Click to Purchase Manufacturing Dashboard in Excel
Why Use a Manufacturing Dashboard in Excel?
Manufacturing involves a lot of moving parts. Between tracking quantity produced, monitoring downtime, and calculating efficiency, you need a system that consolidates everything into one place. An Excel-based dashboard does just that:
- It simplifies complex data.
- It provides quick visual analysis.
- It empowers decision-making.
Let’s dive into what makes this dashboard so efficient and how you can use it to improve your manufacturing process.
Key Features of the Manufacturing Dashboard in Excel
This ready-to-use dashboard makes your manufacturing data actionable. Below are the most exciting features:
Page Navigator
Located at the top of the dashboard, the Page Navigator allows you to easily move across different analytical pages without losing your context.
Slicers for Dynamic Filtering
You can quickly filter the data using six slicers placed on the left and right sides of the dashboard:
- Plant
- Year
- Month
- Category
- Product
- Supervisor
This ensures you see only the data you care about at that moment.
Multi-Page Layout for Focused Analysis
The dashboard is divided into five powerful worksheet pages, each with a specific purpose:
Click to Purchase Manufacturing Dashboard in Excel
Overview Page
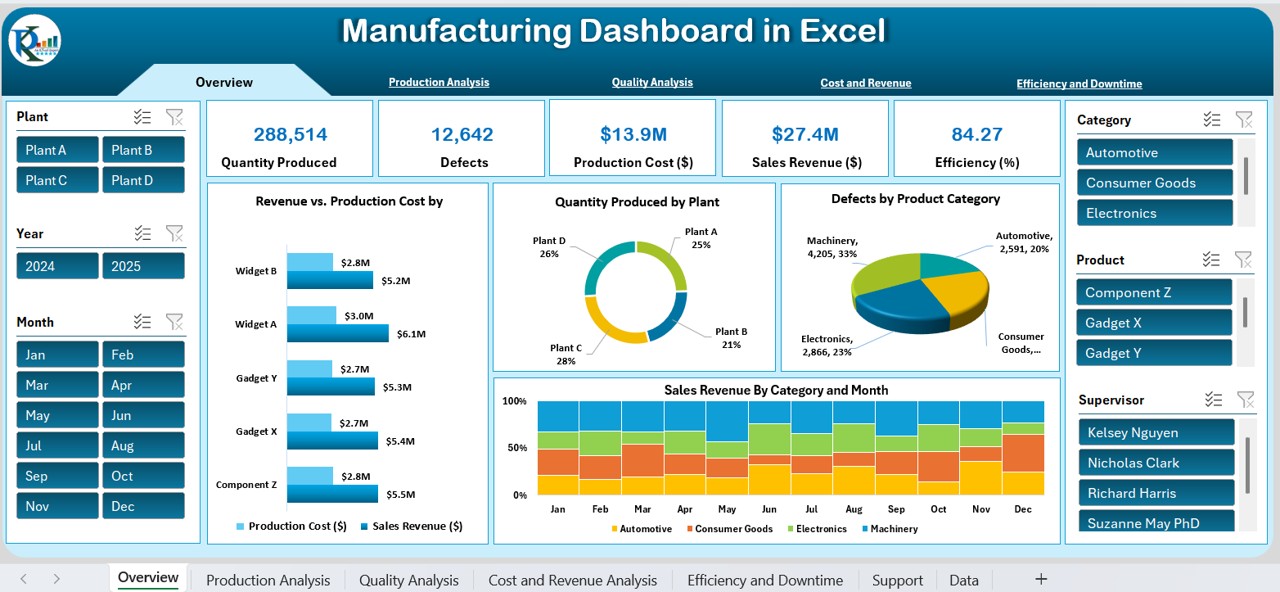
The Overview sheet is the control center of the dashboard. It provides:
- 5 Key Metrics Cards:
- Quantity Produced
- Defects
- Production Cost
- Sales Revenue
- Efficiency
4 Detailed Charts:
- Revenue vs. Production Cost by Category
- Quantity Produced by Plant
- Defects by Product Category
- Sales Revenue by Category and Month
This page gives you a quick summary of overall performance.
Production Analysis
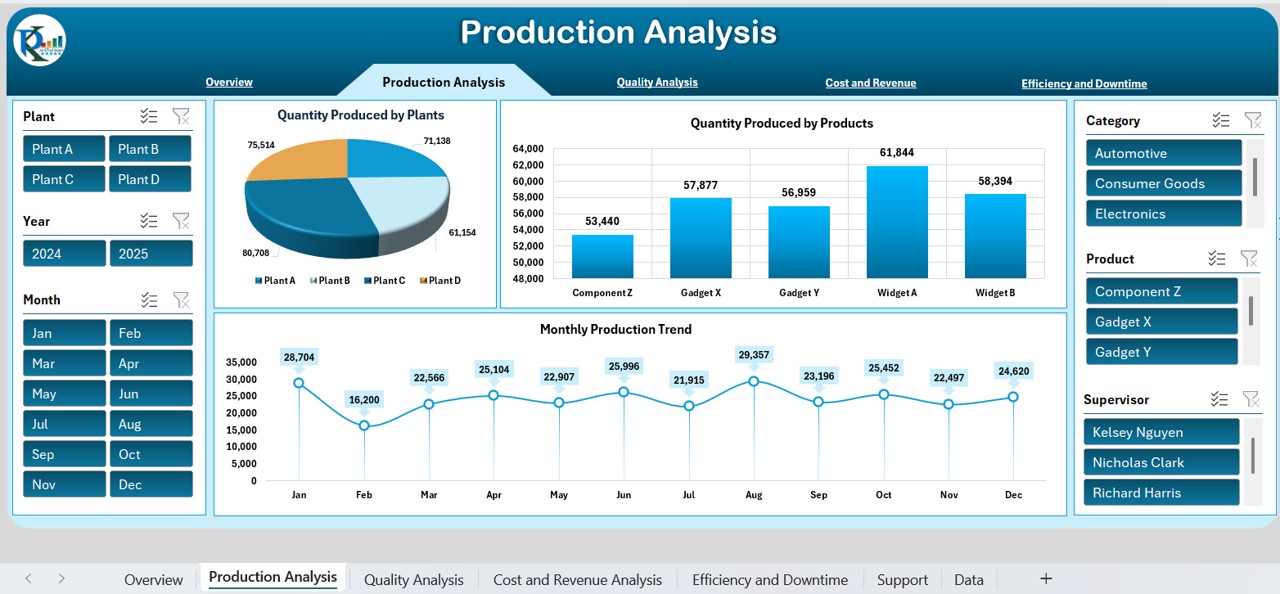
If you want to dive deeper into production trends, this page is for you.
Charts Include:
- Quantity Produced by Plant
- Quantity Produced by Product
- Monthly Production Trend
You can easily identify underperforming plants or products and take necessary action.
Quantity Analysis
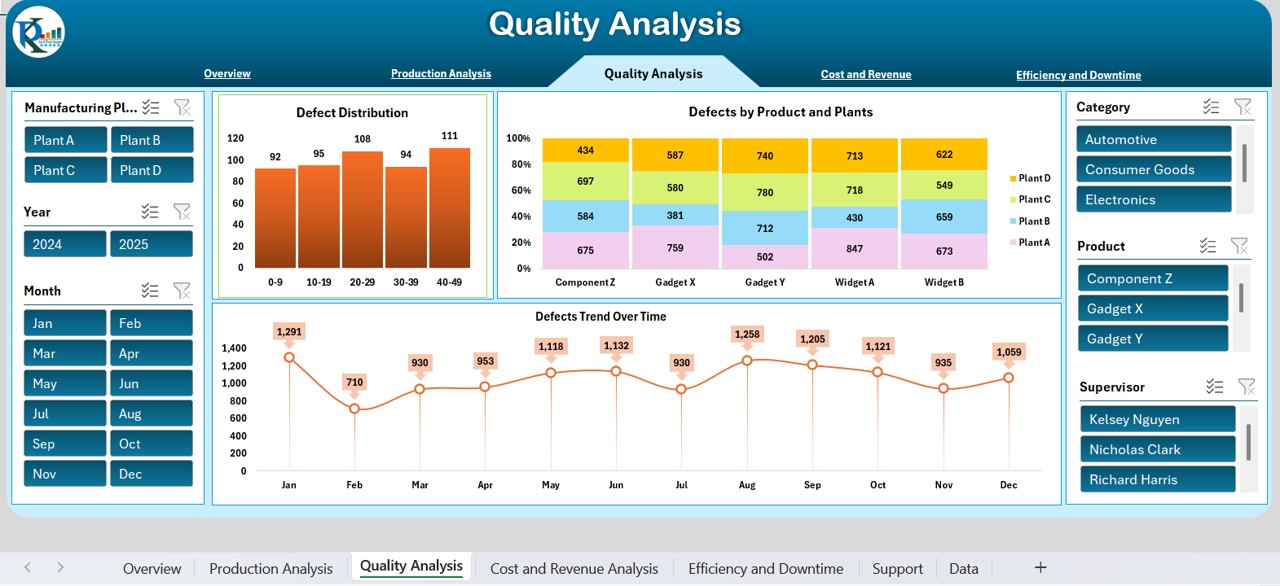
This page focuses on defect management.
Charts Included:
- Defects Distribution
- Defects by Product and Plant
- Defects Trend over Time
Click to Purchase Manufacturing Dashboard in Excel
You can pinpoint where most defects are coming from and act quickly to fix the issue.
Cost and Revenue Analysis
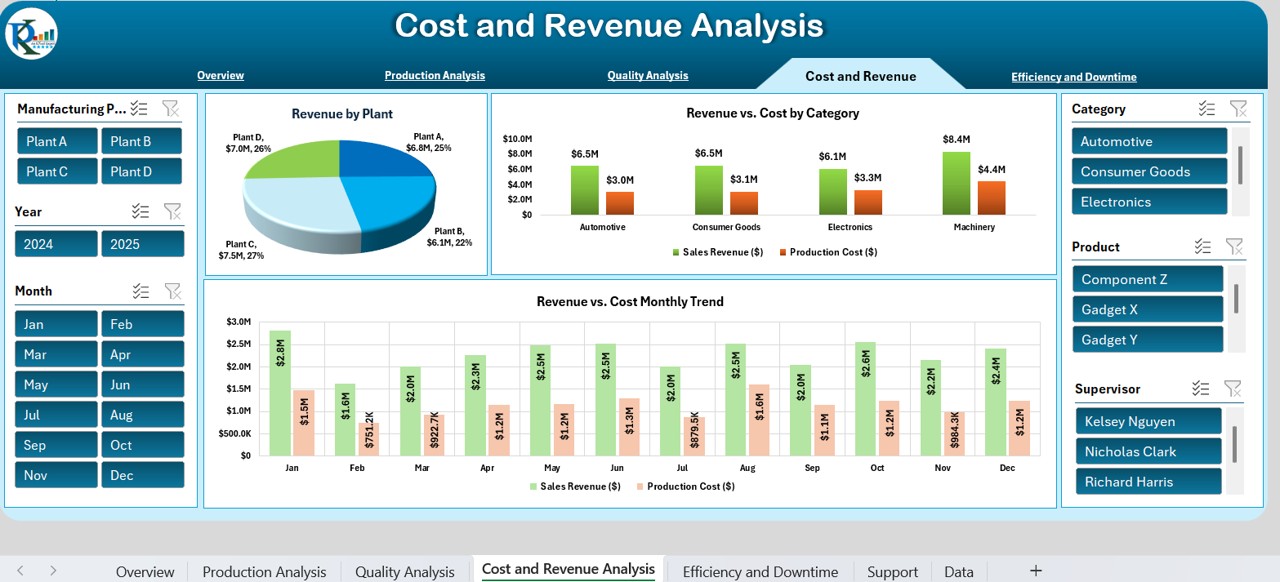
This section focuses on financials—the lifeblood of any manufacturing setup.
Charts Featured:
- Revenue by Plant
- Revenue vs. Cost by Category
- Monthly Revenue vs. Cost Trend
It helps you compare your cost against revenue and make data-driven financial decisions.
Efficiency and Downtime
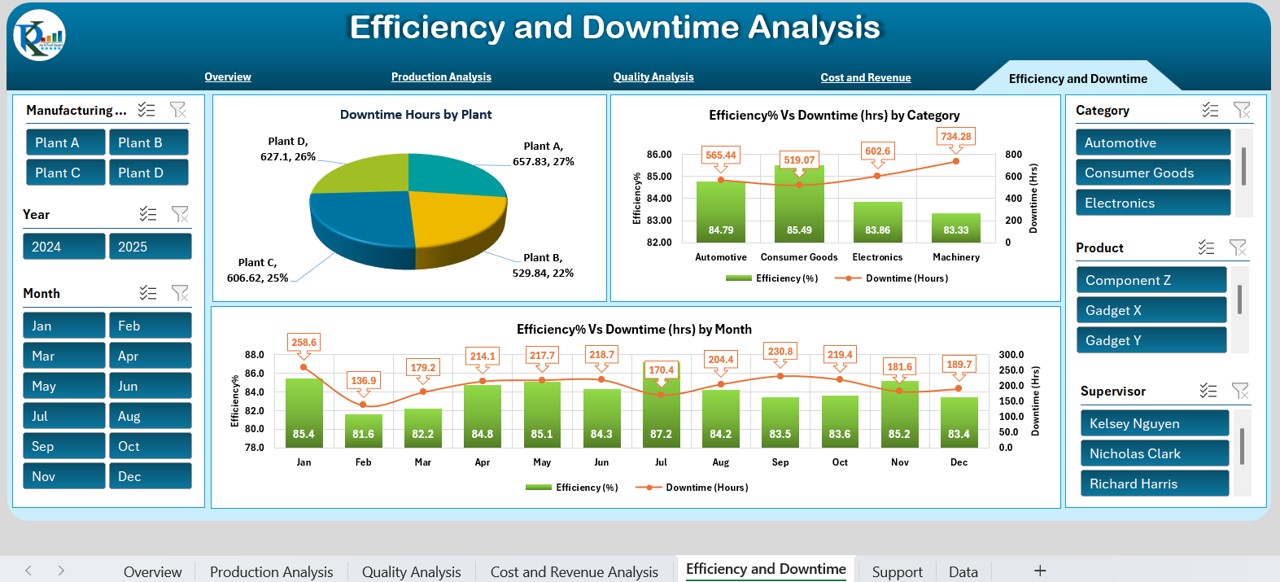
Efficiency directly impacts production output. This page provides an in-depth look:
Charts Provided:
- Downtime Hours by Plant
- Efficiency % vs. Downtime by Category
- Efficiency % vs. Downtime by Month
These visuals allow you to monitor where and why your processes are slowing down.
Data and Support Sheets
Support Sheet Tab
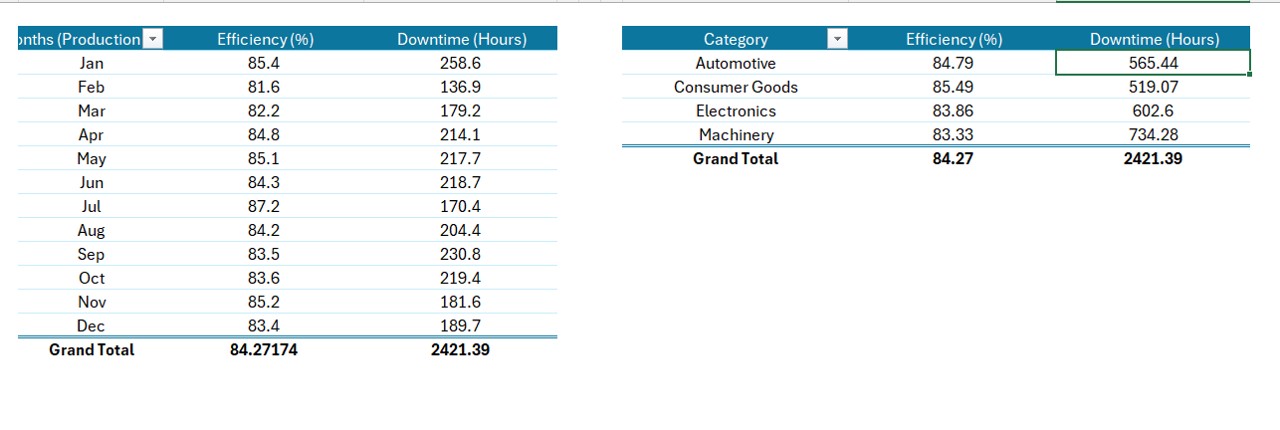
This sheet holds the backend pivot tables. It powers all charts and slicers. You don’t need to touch it—just hide it!
Data Sheet Tab
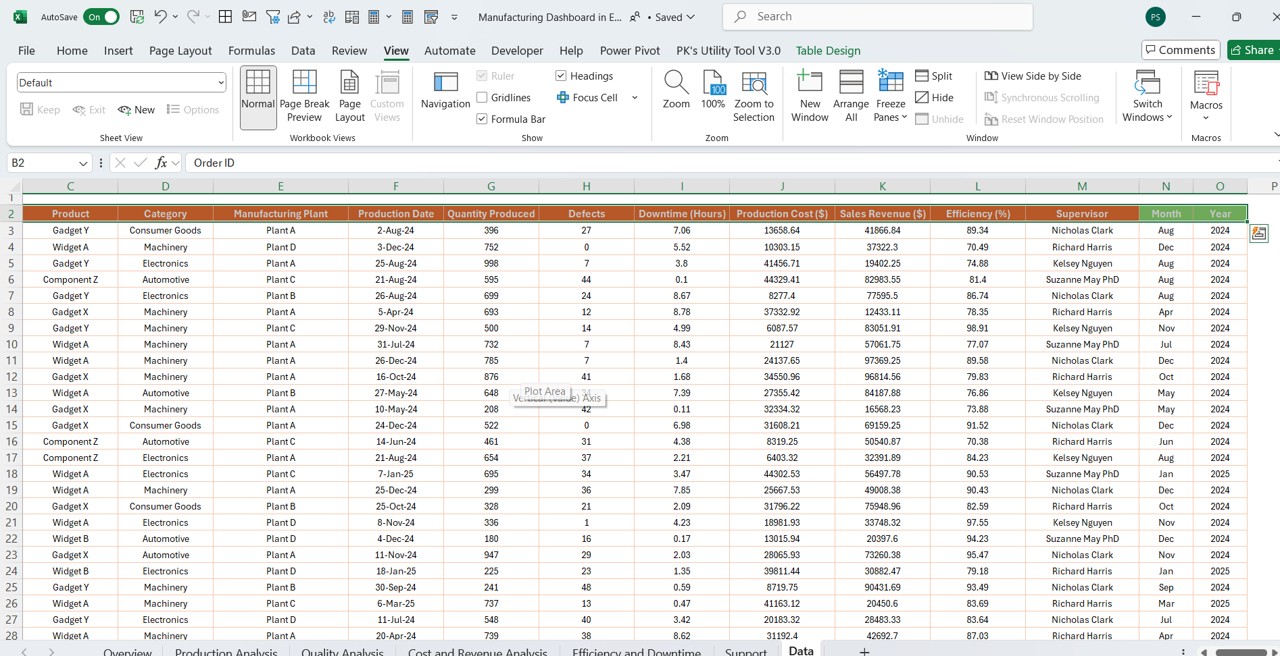
Here’s what this sheet tracks:
Order ID
- Product
- Category
- Manufacturing Plant
- Production Date
- Quantity Produced
- Defects
- Downtime (Hours)
- Production Cost ($)
- Sales Revenue ($)
- Efficiency (%)
- Supervisor
- Month
- Year
It serves as the main source of raw data for the dashboard.
Best Practices for the Manufacturing Dashboard in Excel
To get the most out of your dashboard, follow these best practices:
- Update your data regularly to keep the visuals current.
- Use slicers strategically to narrow down to what matters most.
- Avoid editing the Support tab, as it powers the entire dashboard.
- Train your team on how to use filters and interpret charts.
Advantages of Using a Manufacturing Dashboard in Excel
Still wondering why this dashboard is a game-changer? Let’s break it down:
✅ Real-Time Decision Making: Make faster and smarter decisions with real-time data.
✅ Visual Clarity: Charts and slicers simplify complex datasets.
✅ Cost-Effective: No need for expensive BI tools. Excel does the job!
✅ Customizable: Add your own KPIs, slicers, and visuals as needed.
✅ Improved Productivity: Easily identify bottlenecks and optimize resources.
How Does This Dashboard Help Financial Analysts?
Financial analysts often struggle with scattered data. With this dashboard, they can:
- Monitor revenue and production costs in one place
- Spot trends over time for budget planning
- Compare plant-wise profitability instantly
What Makes This Excel Dashboard Better Than Others?
- Navigation bar for easy access to all key pages
- Multiple slicers for granular analysis
- Separate sheets for production, revenue, efficiency, and defects
- No coding needed
- Plug-and-play format
Conclusion
In a fast-paced manufacturing environment, staying on top of your production data is essential. This Manufacturing Dashboard in Excel gives you everything you need to keep your operations running smoothly. From high-level overviews to granular defect analysis, this dashboard transforms your data into powerful insights.
If you haven’t used a manufacturing dashboard before, now’s the perfect time to start. It’s simple, effective, and made for Excel lovers like you!
Frequently Asked Questions (FAQs)
❓ What is a Manufacturing Dashboard in Excel?
A manufacturing dashboard in Excel is a visual tool that tracks KPIs such as production quantity, cost, revenue, efficiency, and defects using charts, slicers, and tables.
❓ Can I customize this dashboard for my plant?
Absolutely! You can add new slicers, charts, or KPIs based on your plant’s specific needs.
❓ Do I need to know Excel VBA to use this dashboard?
No. This dashboard is built using formulas, pivot tables, and slicers—no coding required.
❓ How often should I update the data?
Update the data sheet as frequently as your production schedule demands. Daily or weekly updates are most common.
❓ Is it possible to track multiple plants in this dashboard?
Yes! The slicer for “Plant” lets you toggle between different plant data for comparison and focused analysis.
❓ Can I use this dashboard for financial reporting?
Yes, this dashboard has a dedicated section for revenue vs. cost analysis, perfect for financial insights.
Click to Purchase Manufacturing Dashboard in Excel
Visit our YouTube channel to learn step-by-step video tutorials