
Keeping track of financial performance in the manufacturing sector can be overwhelming. However, with the right tools in place, businesses can measure, monitor, and improve their financial health effectively. That’s exactly where the Manufacturing Financial Health KPI Dashboard in Excel comes into play. In this article, you will learn everything about this ready-to-use template that simplifies financial KPI tracking and offers powerful insights at a glance.
Click to Purchase Manufacturing Financial Health KPI Dashboard in Excel
What is a Manufacturing Financial Health KPI Dashboard?
A Manufacturing Financial Health KPI Dashboard is a structured Excel-based template designed to track key financial performance indicators (KPIs) for manufacturing operations. This dashboard helps manufacturing businesses analyze monthly and yearly financial performance using actual, target, and historical data. It also provides visual feedback such as trends and conditional formatting with up/down arrows.
This template can save time, enhance accuracy, and help decision-makers act quickly based on real-time data insights.
Why Do Manufacturers Need This Dashboard?
Manufacturers face increasing pressure to remain competitive, reduce waste, and boost profitability. Tracking financial KPIs is not just helpful; it is necessary. This dashboard simplifies that process by offering:
- Instant visibility into month-to-date (MTD) and year-to-date (YTD) numbers
- A quick comparison with targets and previous year data
- Visual insights that promote smarter decisions
Key Features of the Manufacturing Financial Health KPI Dashboard
This Excel-based dashboard includes 7 worksheet tabs, each playing a specific role:
Home Sheet
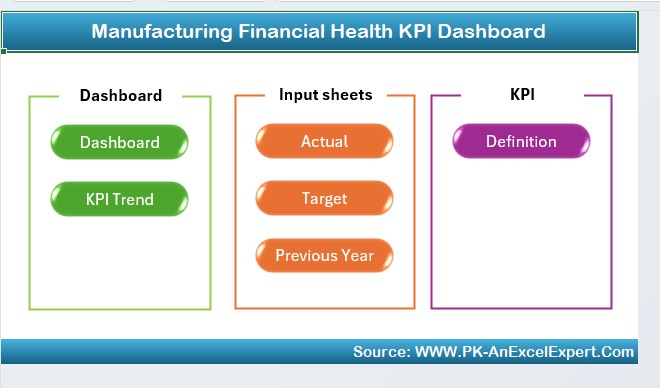
The Home Sheet works as the navigation center. It includes six interactive buttons that allow users to jump directly to the corresponding sheet. This layout improves accessibility and saves time.
Dashboard Sheet Tab
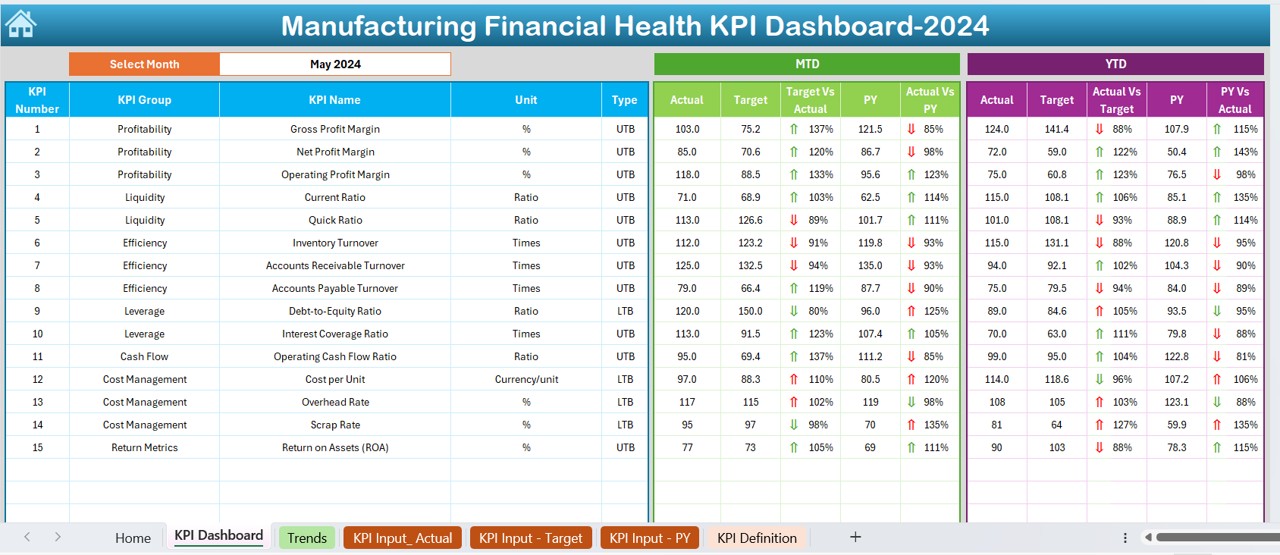
This is the heart of the template. From here, you can monitor:
- All KPIs in one place
- Dynamic data based on the month selection in cell D3
- MTD Actual, Target, and Previous Year data
- YTD Actual, Target, and Previous Year data
- Automatic variance calculations (Target vs Actual, PY vs Actual)
- Conditional formatting with arrows to highlight performance (up/down)
KPI Trend Sheet Tab
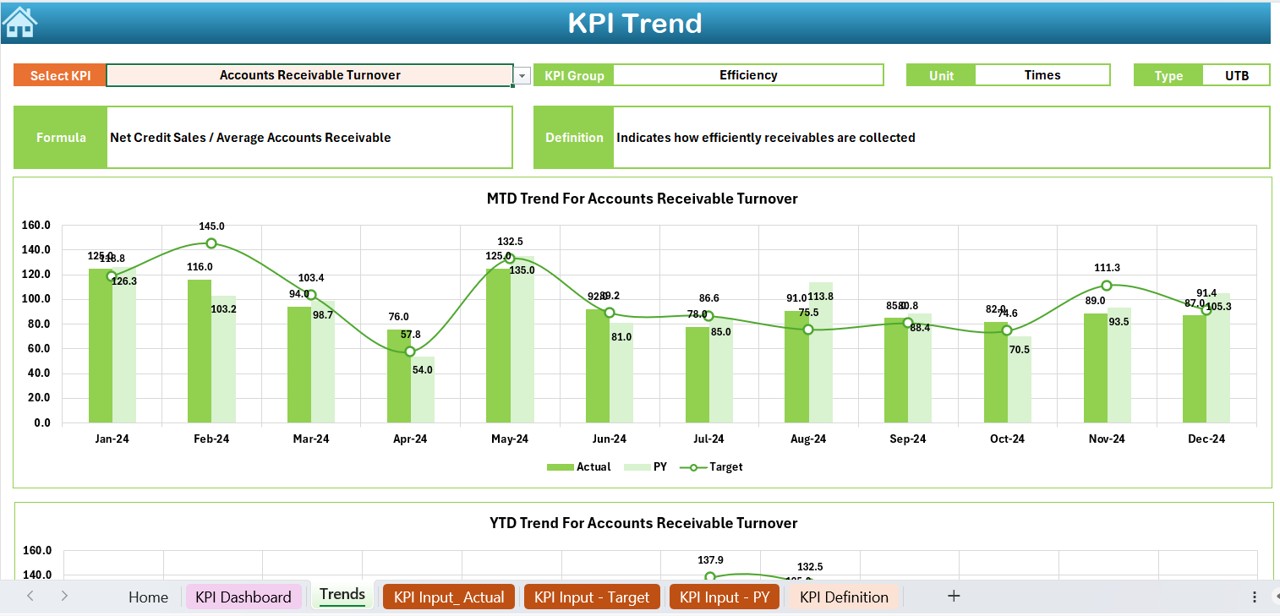
Dive deep into trends by selecting a KPI from the dropdown at cell C3. The sheet displays:
- KPI Group
- Unit of Measurement
- KPI Type (Lower the Better or Upper the Better)
- KPI Formula and Definition
- Visual charts for both MTD and YTD performance
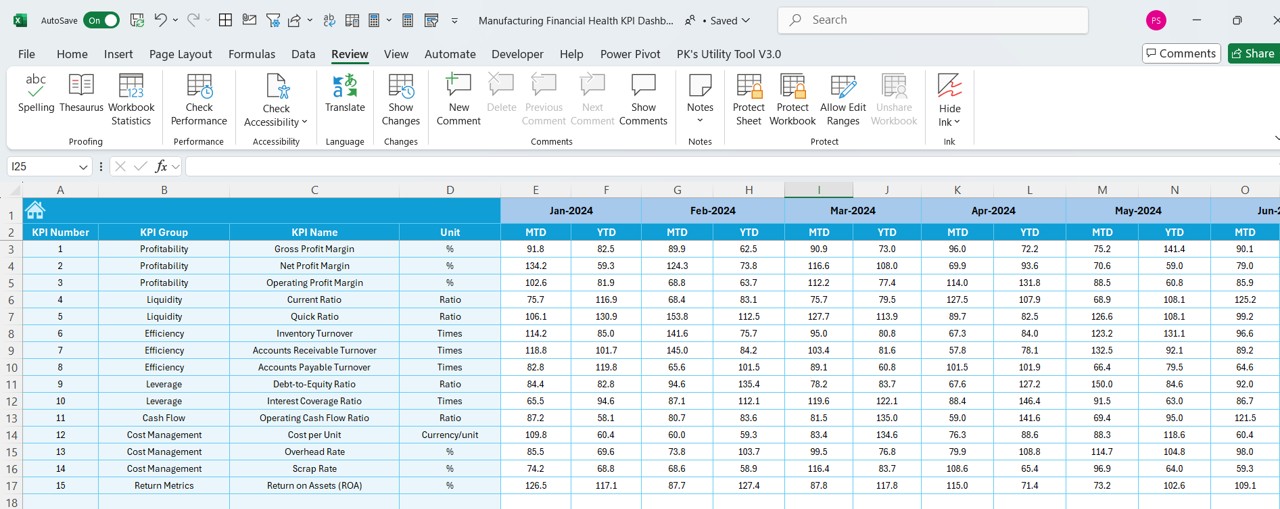
Actual Numbers Input Sheet
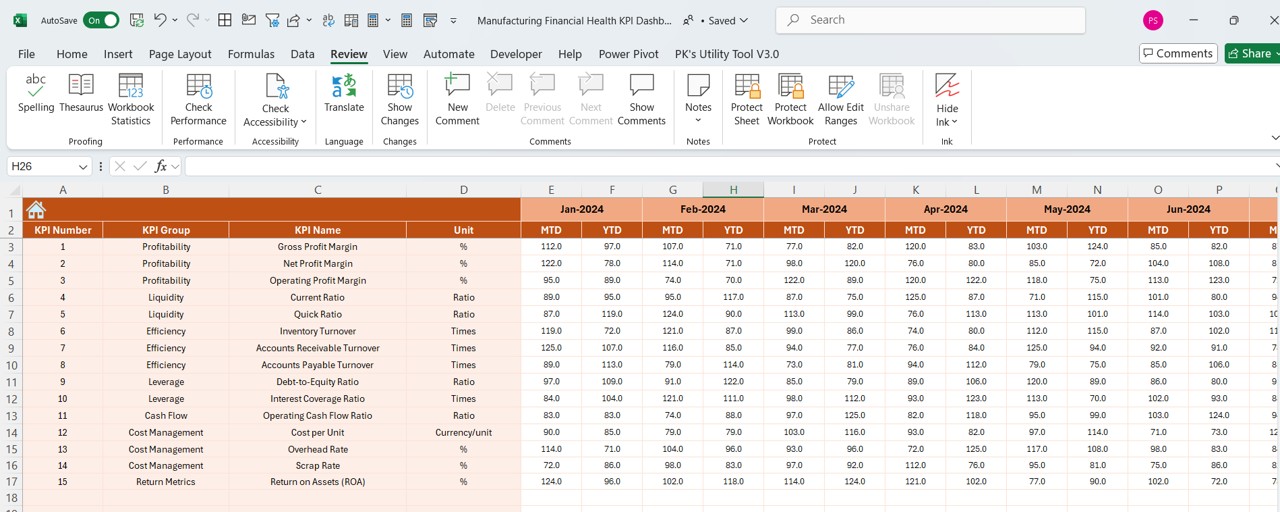
- Enter MTD and YTD actual numbers for each KPI here. To adjust the time period, change the month in cell E1. This flexibility makes monthly tracking effortless.
Click to Purchase Manufacturing Financial Health KPI Dashboard in Excel
Target Sheet Tab
- Set monthly targets for all KPIs. You can input both MTD and YTD targets, making this sheet vital for performance benchmarking.
Previous Year Number Sheet Tab
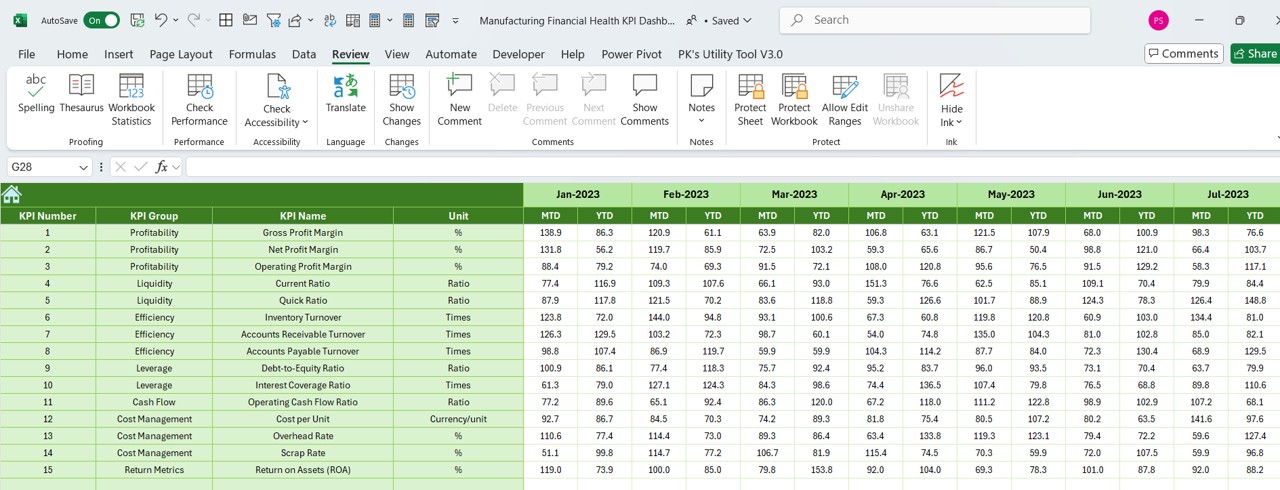
- Provide the historical data for each KPI in this section. This allows for a clear comparison between the current and previous year’s performance.
KPI Definition Sheet Tab
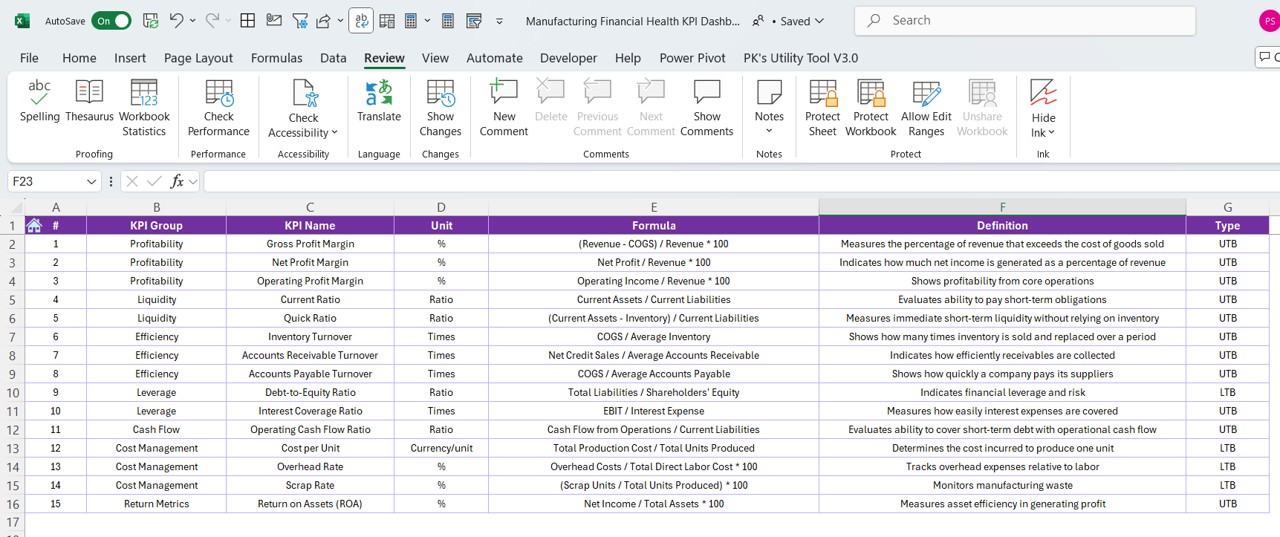
Define each KPI clearly. Include:
- KPI Name
- KPI Group
- Unit of Measurement
- Formula
- KPI Definition
This sheet ensures transparency and consistency in reporting.
Advantages of the Manufacturing Financial Health KPI Dashboard
✅ Easy to Use: Even those with basic Excel skills can use this dashboard effectively.
✅ Real-Time Monitoring: Track monthly and yearly performance instantly with dropdown selectors.
✅ Data-Driven Decisions: Make decisions based on trends, comparisons, and visual cues like arrows and charts.
✅ Standardized Reporting: Use one format for all your financial KPIs to keep reports consistent across teams.
✅ Saves Time: Eliminates manual work with auto-updating dashboards based on entered data.
Best Practices for Using the KPI Dashboard
To make the most of this dashboard, follow these best practices:
✔️ Update Data Regularly: Ensure that actual numbers, targets, and previous year data are up-to-date.
✔️ Use Clear KPI Definitions: Keep KPI descriptions simple and clear to avoid confusion.
✔️ Set Realistic Targets: Base targets on historical trends and business goals.
✔️ Analyze Trends Frequently: Use the trend sheet to analyze why KPIs are up or down.
✔️ Involve Your Team: Share insights with the finance and operations teams for alignment.
🚀 How to Customize the Dashboard for Your Business
Although the dashboard comes ready-to-use, you can easily tailor it to your needs:
✏️ Add New KPIs: Use the KPI Definition sheet to include additional metrics.
✏️ Change Units or Formulas: Modify units and calculations based on your business type.
✏️ Rebrand the Dashboard: Add your company logo and brand colors for a personalized look.
📆 Who Can Use This Dashboard?
This dashboard is ideal for:
🏢 Manufacturing Plant Managers
💼 Finance Teams
📈 Business Analysts
📆 Operations and Strategy Managers
Whether you run a small factory or manage a large industrial unit, this template offers value at every level.
Conclusion
The Manufacturing Financial Health KPI Dashboard in Excel empowers manufacturing professionals to stay in control of their finances. It offers flexibility, clarity, and real-time insights—all packed in a simple Excel file. Instead of juggling multiple reports, use this unified tool to visualize performance and boost business growth.
If you’re ready to streamline your financial tracking and reporting, this dashboard is the perfect starting point.
Frequently Asked Questions (FAQs)
❓ What are the most important financial KPIs in manufacturing?
Some essential financial KPIs include Gross Profit Margin, Operating Cost, Inventory Turnover, Revenue Per Employee, and Net Profit Margin.
❓ Can I customize the KPIs in this dashboard?
Absolutely! Use the KPI Definition sheet to add, remove, or adjust KPIs according to your business needs.
❓ Do I need advanced Excel skills to use this dashboard?
No. The dashboard is beginner friendly. If you can enter data and use dropdowns, you can manage it easily.
❓ Can I track performance monthly and yearly?
Yes! The dashboard supports both MTD (Month-To-Date) and YTD (Year-To-Date) tracking with visual comparisons.
Click to Purchase Manufacturing Financial Health KPI Dashboard in Excel
Visit our YouTube channel to learn step-by-step video tutorials


