Managing inventory in a manufacturing environment can be a complex task. However, when done right, it saves time, reduces costs, and boosts overall efficiency. That’s where a Manufacturing Inventory Management KPI Dashboard in Excel comes in handy. This article will walk you through everything you need to know about creating and using this powerful dashboard to streamline your operations.
What is a Manufacturing Inventory Management KPI Dashboard?
A Manufacturing Inventory Management KPI Dashboard is a visual tool that helps you track and analyze key performance indicators (KPIs) related to your inventory. It provides insights into production stock levels, movement, trends, and overall inventory health. Using Excel to build this dashboard makes it both cost-effective and customizable.
Why Use Excel for Inventory Management?
Click to Purchase Manufacturing Inventory Management KPI Dashboard in Excel
While there are many inventory management systems available, Excel remains a favorite because:
- It’s widely accessible and familiar to most users.
- You can customize it easily.
- It doesn’t require special software or monthly fees.
- It allows complete control over data and layout.
Now, let’s explore what makes this Excel dashboard a must-have for manufacturers.
Key Features of the Manufacturing Inventory Management KPI Dashboard
This ready-to-use Excel template includes 7 worksheets, each designed to provide specific insights and functionality:
Home Sheet
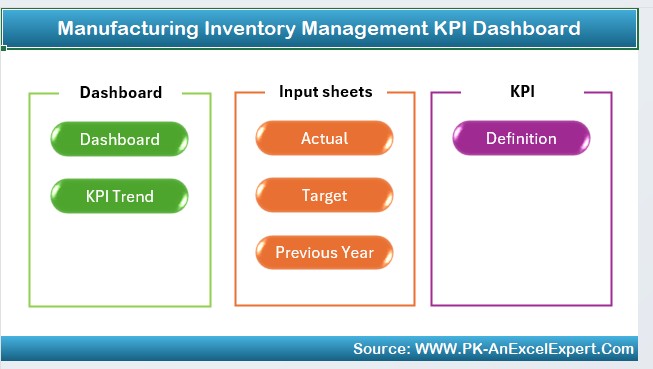
This is your index page. It includes six clickable buttons that let you quickly navigate to the other sheets. It acts like a control center for the entire file.
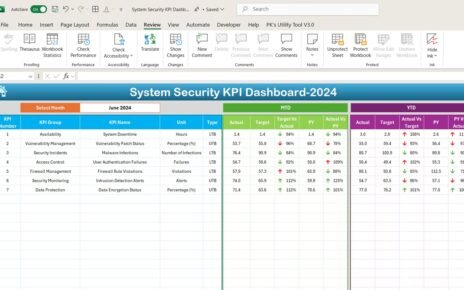
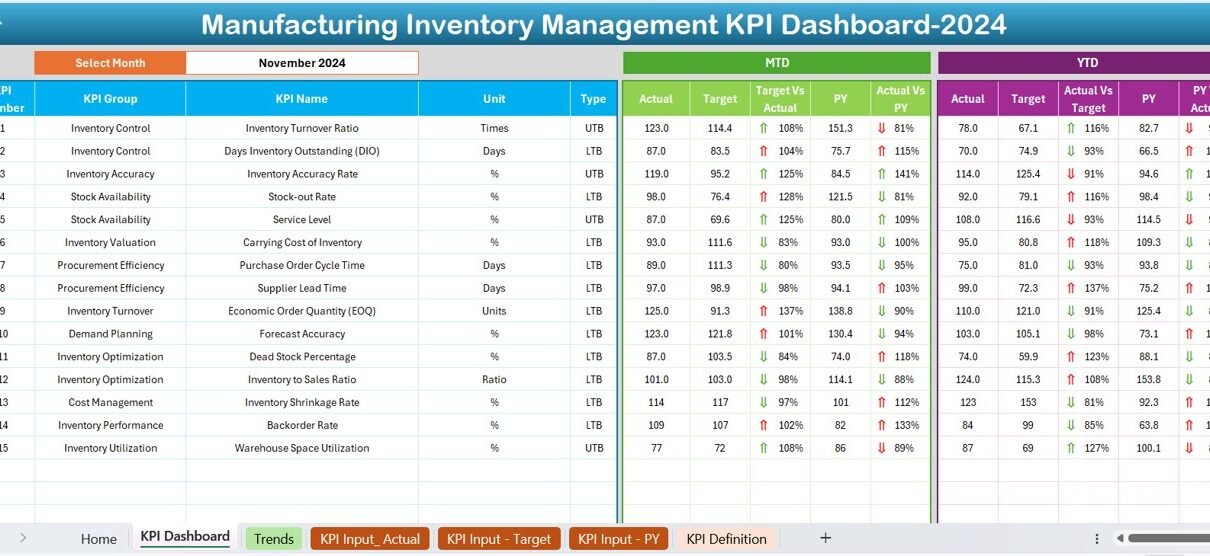
Dashboard Sheet
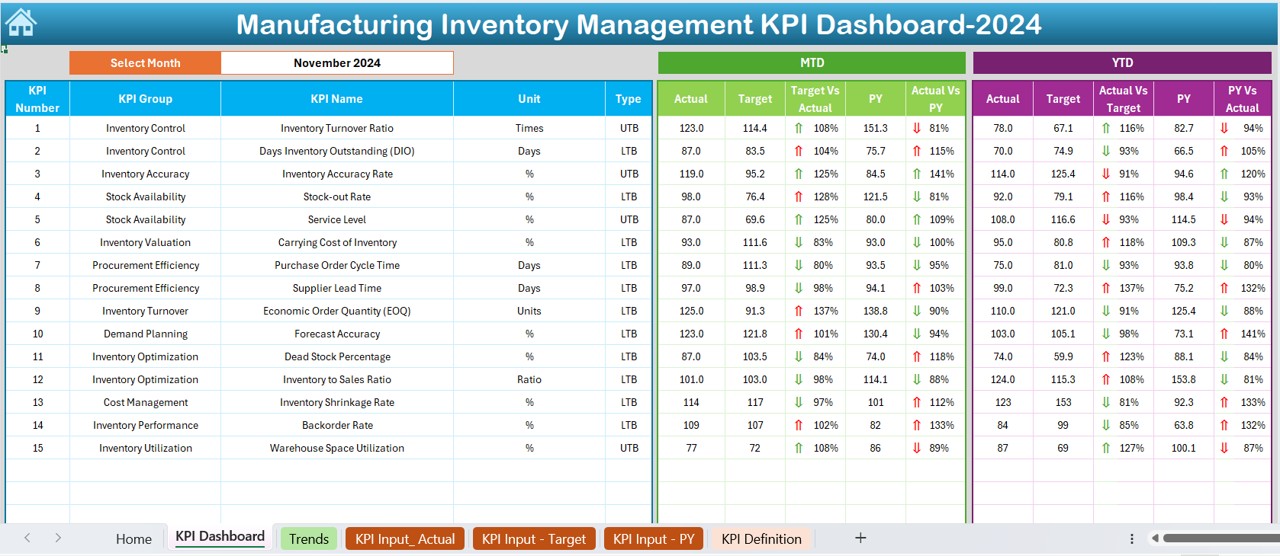
This is the main visualization page where all your KPI data is showcased. Here’s what you can expect:
- Choose the month using a drop-down menu in cell D3.
- View MTD (Month-to-Date) and YTD (Year-to-Date) numbers.
- Compare Actual, Target, and Previous Year (PY) data.
- Get up and down arrows to show whether KPIs are improving or declining.
- Conditional formatting highlights performance visually for easier analysis.
KPI Trend Sheet
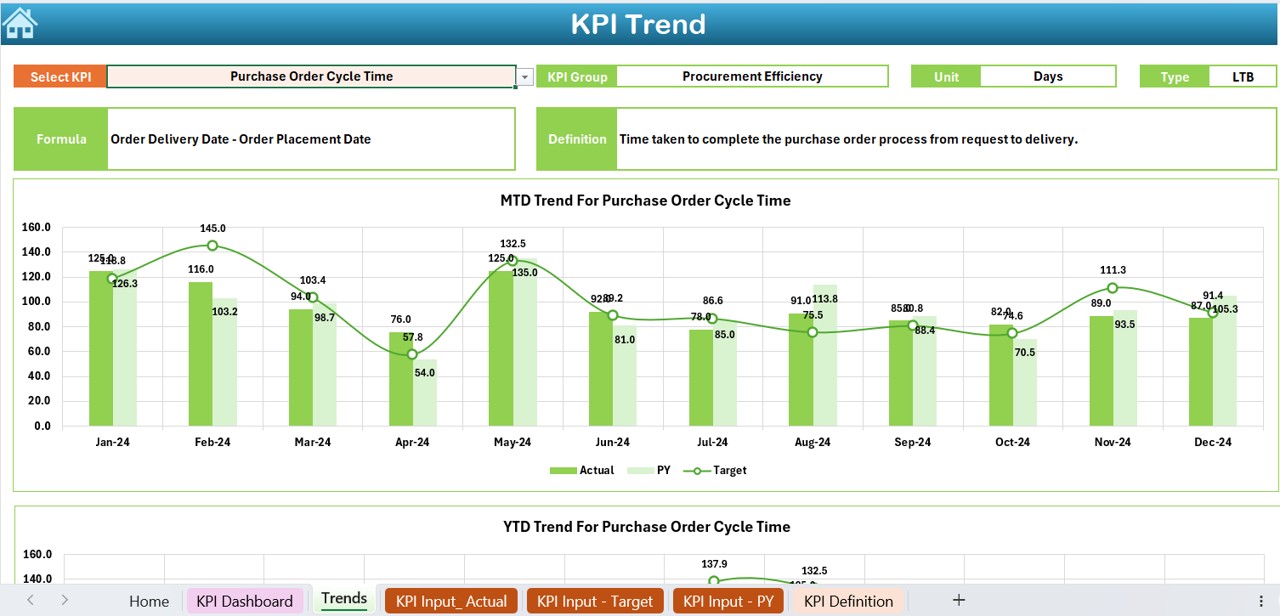
- Select a KPI name from a dropdown in cell C3 and instantly view:
- KPI Group, Unit, Type (Upper/Lower is better), Formula, and Definition.
- Dynamic trend charts for MTD and YTD (Actual, Target, PY).
Actual Numbers Input Sheet
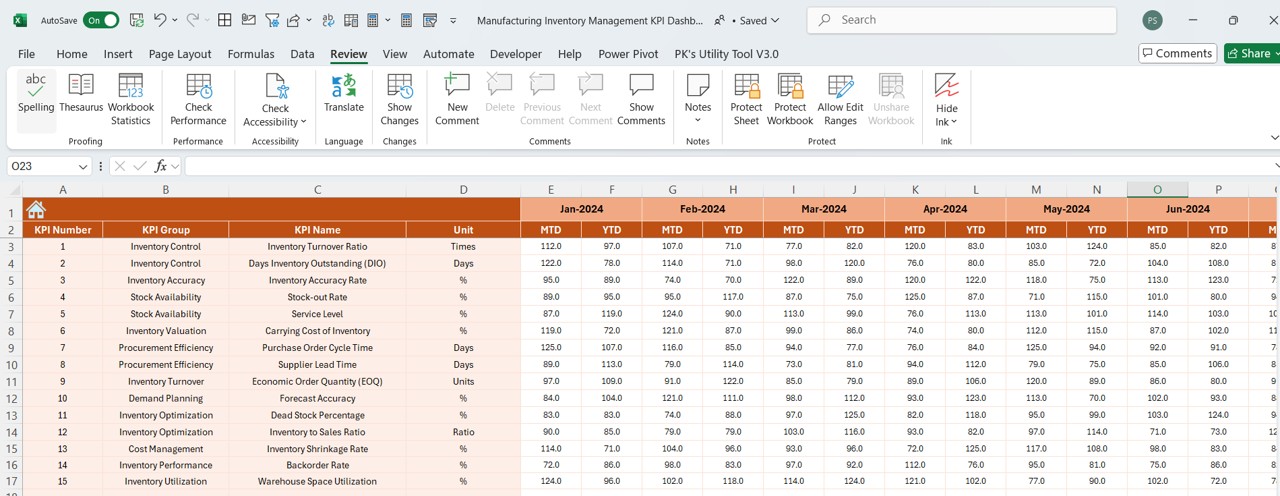
- This sheet allows you to input real-time performance data. Here’s how it works:
- Change the reporting month using cell E1.
- Input MTD and YTD figures for selected KPIs.
Click to Purchase Manufacturing Inventory Management KPI Dashboard in Excel
Target Sheet
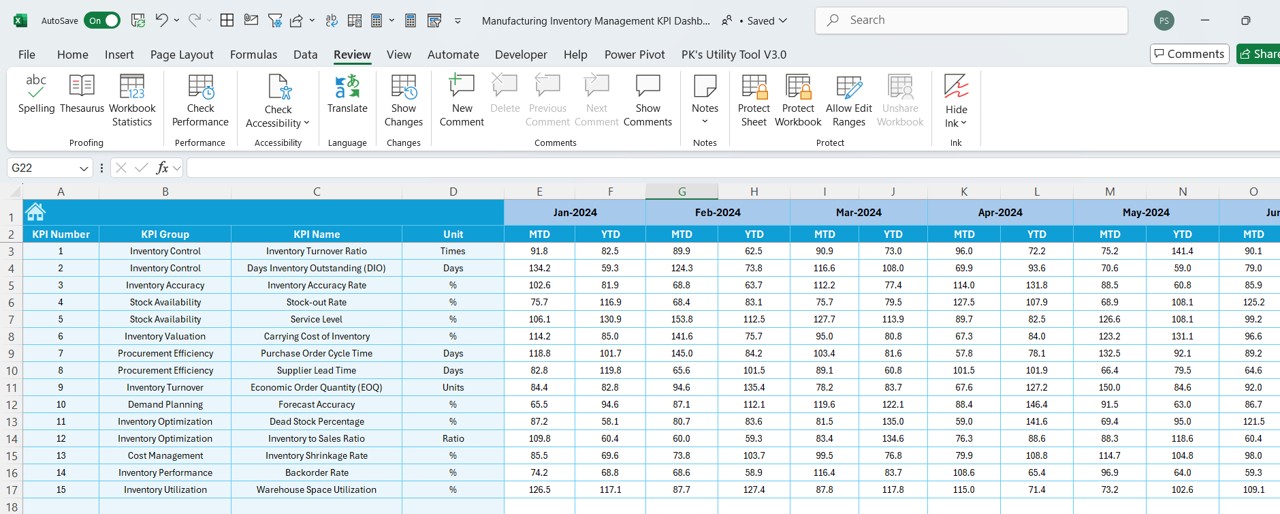
- Enter your planned targets here:
- Monthly and Year-to-Date goals for each KPI.
- Helps in goal tracking and performance reviews.
Previous Year Numbers Sheet
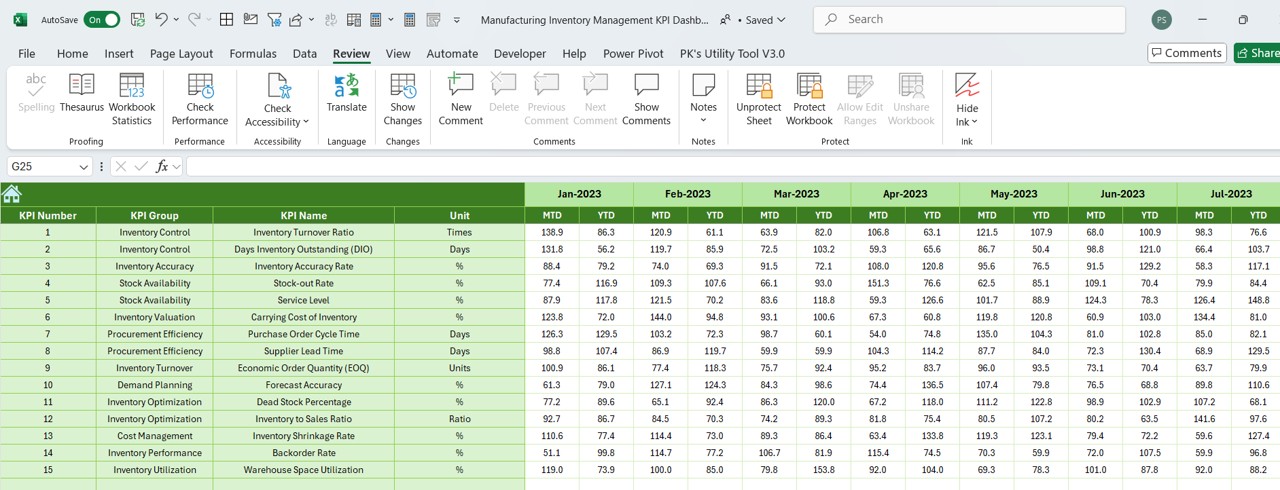
- Maintain historical performance for comparison:
- Add last year’s values to monitor growth or decline.
KPI Definition Sheet
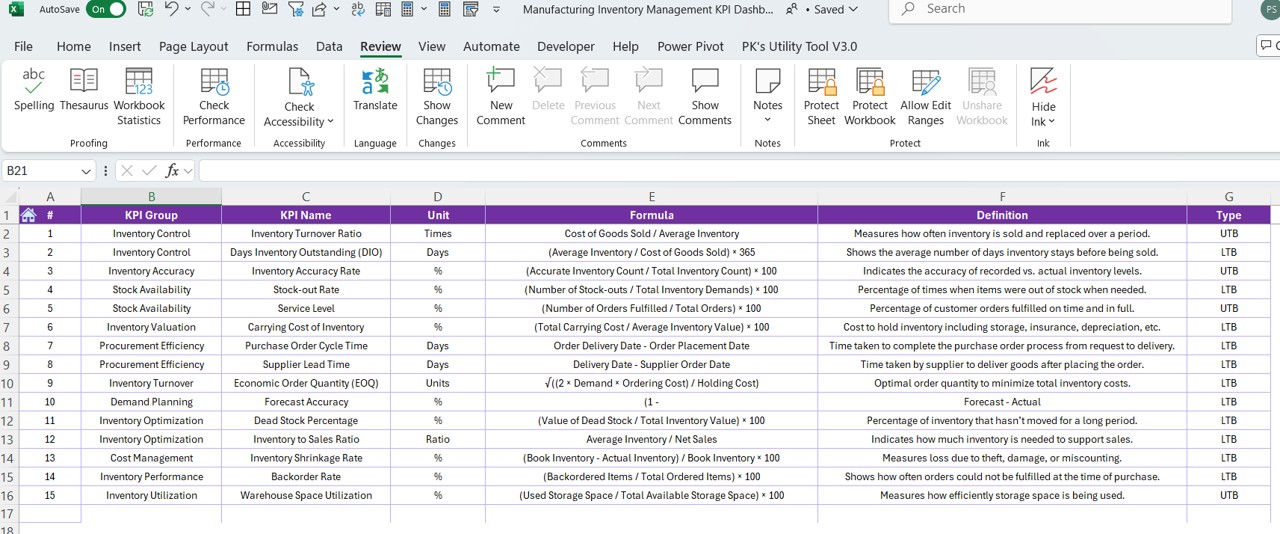
- Document your KPI logic clearly:
- Include KPI Name, Group, Unit, Formula, and Definition.
- Helps team members understand each KPI in detail.
Advantages of Using a KPI Dashboard for Inventory Management
Using this KPI dashboard offers numerous benefits:
✅ Real-Time Tracking: Always know your current performance against your goals.
✅ Data-Driven Decisions: Make smart choices based on accurate numbers.
✅ Improved Visibility: Gain a complete overview of inventory health and trends.
✅ Quick Insights: Visual indicators make it easy to spot issues early.
✅ Historical Comparison: Understand how performance changes over time.
🥇 Best Practices for Using This Dashboard
To get the most out of your Manufacturing Inventory Management KPI Dashboard in Excel, follow these best practices:
- Update Regularly: Enter actual numbers at least once a month.
- Set Clear Targets: Keep your goals realistic and aligned with business strategy.
- Use Conditional Formatting Smartly: Let colors and symbols guide your attention.
- Review Trends: Use the KPI trend sheet to understand patterns.
- Keep Definitions Clear: Ensure every team member knows what each KPI means.
- Back-Up Your File: Always keep a saved version before making updates.
Conclusion
A Manufacturing Inventory Management KPI Dashboard in Excel gives you control, visibility, and actionable insights. With this tool, you can easily track your inventory performance, identify gaps, and make informed decisions. It’s not just a spreadsheet; it’s your roadmap to operational success.
Frequently Asked Questions (FAQs)
What is the purpose of a KPI Dashboard in manufacturing?
A KPI dashboard helps monitor performance metrics like stock levels, order accuracy, and production efficiency in real-time.
Can I add more KPIs to this Excel dashboard?
Yes! You can customize it by adding rows and updating formulas as needed.
How often should I update the dashboard?
It’s best to update the actual numbers monthly and review targets quarterly.
Is this dashboard suitable for small manufacturers?
Absolutely. It works great for both small and mid-sized manufacturers.
Do I need advanced Excel skills to use this dashboard?
Not at all. Basic Excel knowledge is enough. The layout is user-friendly and straightforward.
Click to Purchase Manufacturing Inventory Management KPI Dashboard in Excel
Visit our YouTube channel to learn step-by-step video tutorials
Watch the step-by-step video Demo: