In today’s highly competitive manufacturing world, tracking your performance and identifying areas for market growth is not just smart—it’s essential. That’s exactly why having a Manufacturing Market Expansion KPI Dashboard in Excel can be a game-changer for your business. With the right KPIs and a well-structured dashboard, manufacturers can make data-driven decisions and expand into new markets with confidence.
In this comprehensive article, we’ll walk you through everything you need to know about this powerful Excel dashboard. We’ll also show you how it works, its advantages, best practices, and commonly asked questions—all while keeping the language easy, clear, and actionable.
What is a Manufacturing Market Expansion KPI Dashboard?
A Manufacturing Market Expansion KPI Dashboard is a smart Excel tool that allows you to track, analyze, and monitor the performance of your market growth strategy. It displays both monthly (MTD) and year-to-date (YTD) metrics, including actual numbers, targets, and comparisons with previous years.
With interactive charts, conditional formatting, and dropdowns, this dashboard simplifies complex data into visual insights that are easy to interpret.
Overview of the Dashboard Structure
The dashboard is thoughtfully designed using 7 worksheet tabs, each serving a specific purpose:
Home Sheet
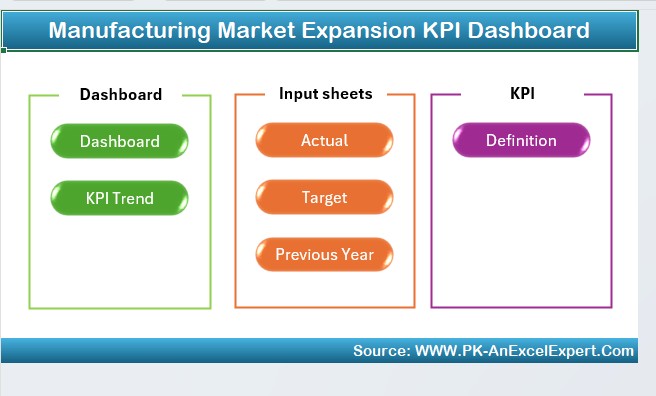
This acts as the navigation center for your dashboard. It contains clickable buttons that help you jump directly to the following tabs:
- Dashboard
- KPI Trend
- Actual Numbers
- Target Sheet
- Previous Year Numbers
- KPI Definition
Click to Purchase Manufacturing Market Expansion KPI Dashboard in Excel
Dashboard Sheet Tab
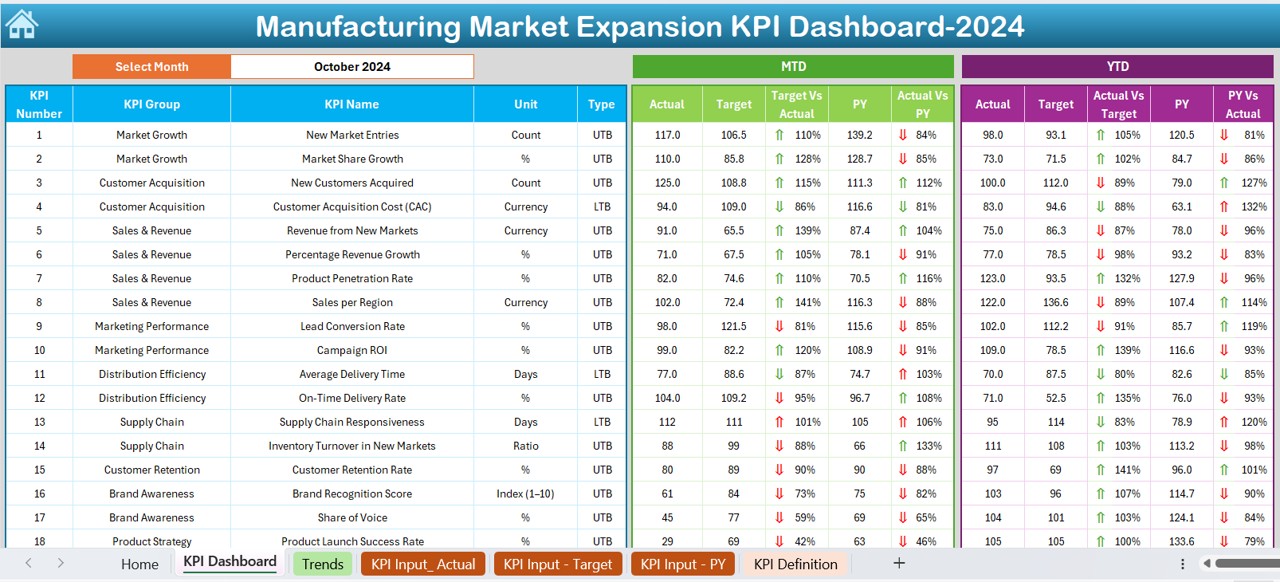
This is the heart of the dashboard. It includes a dropdown menu in cell D3 that allows you to select any month. Once selected, the data updates dynamically for that month.
Here’s what it shows:
- MTD Actual, Target, and Previous Year
- YTD Actual, Target, and Previous Year
- Target vs Actual with up/down arrows
- Previous Year vs Actual with arrows using conditional formatting
This visual layer helps you quickly analyze where your numbers stand.
KPI Trend Sheet Tab
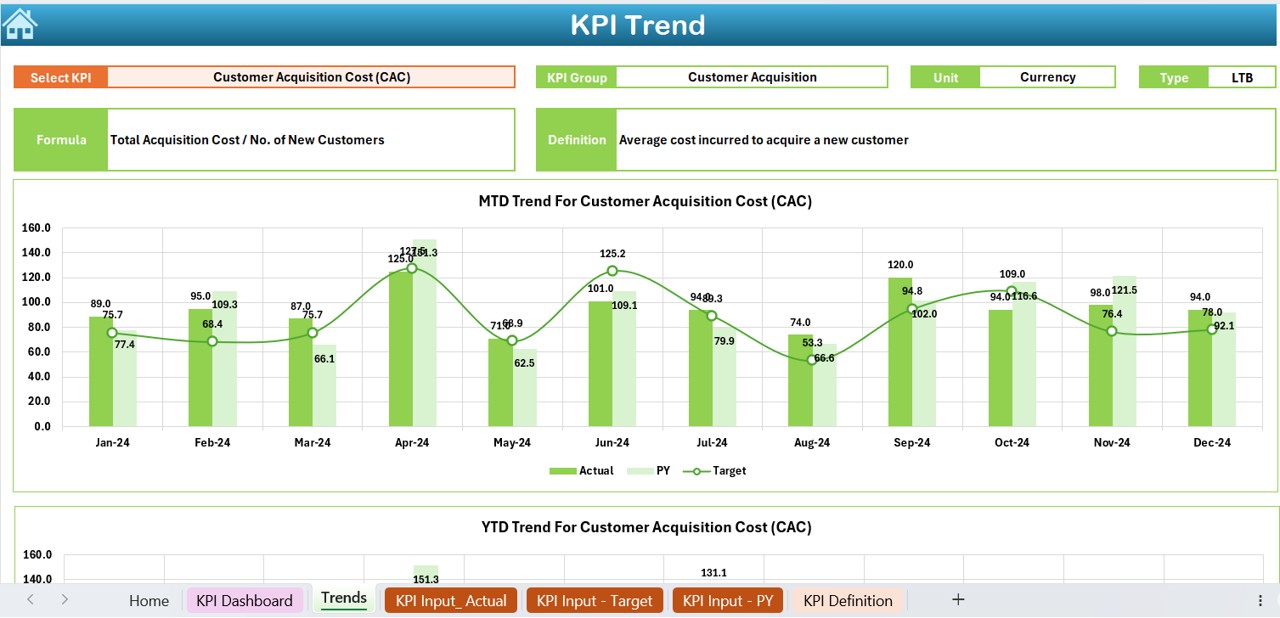
Want to look at trends for a specific KPI? You can easily select a KPI from the dropdown in cell C3. The sheet then displays:
- KPI Group
- Unit of Measurement
- Type of KPI (Lower the Better or Upper the Better)
- KPI Formula and Definition
- Trend charts for MTD and YTD data across Actual, Target, and Previous Year
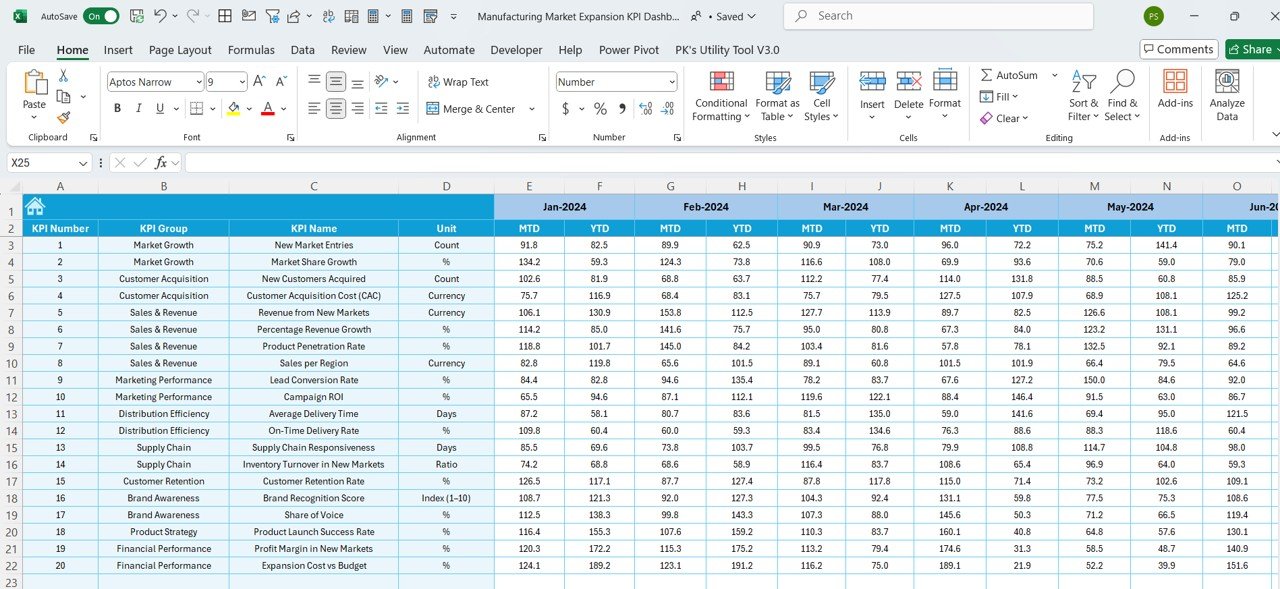
Actual Numbers Input Sheet
Here’s where your real-time data gets recorded. Simply enter your monthly MTD and YTD actual numbers. Set your starting month in cell E1, and you’re good to go.
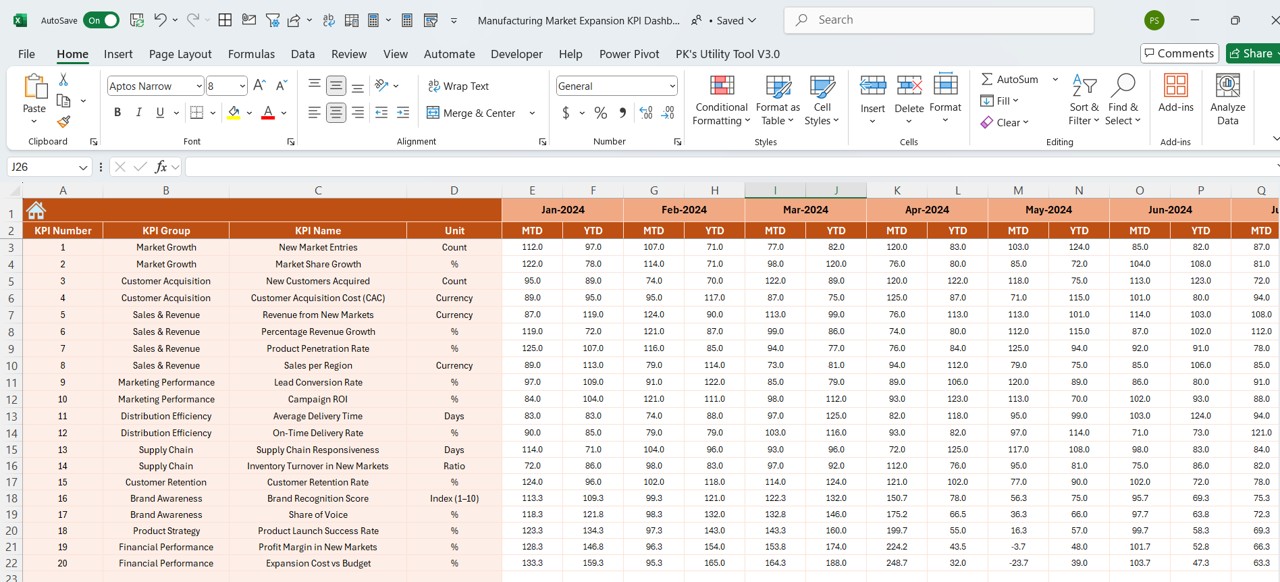
Target Sheet Tab
This tab is for entering your planned goals or targets. It’s divided by KPI and tracks both MTD and YTD values.
Previous Year Numbers Sheet
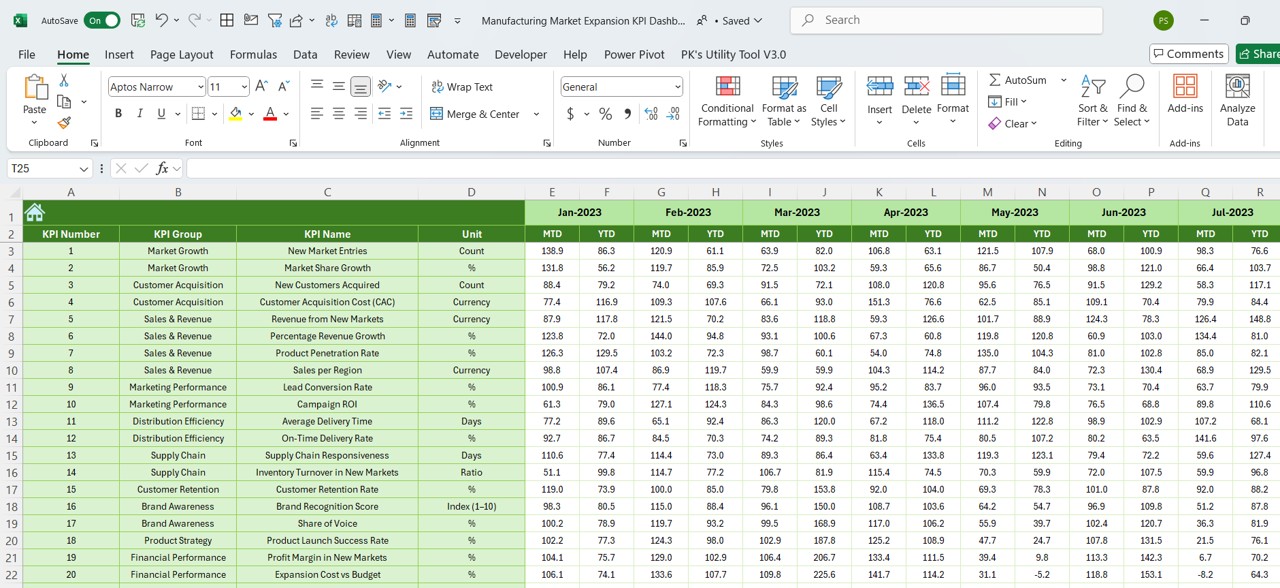
To analyze growth, you’ll need past performance data. This sheet lets you input the same KPIs and monthly values from the previous year.
KPI Definition Sheet Tab
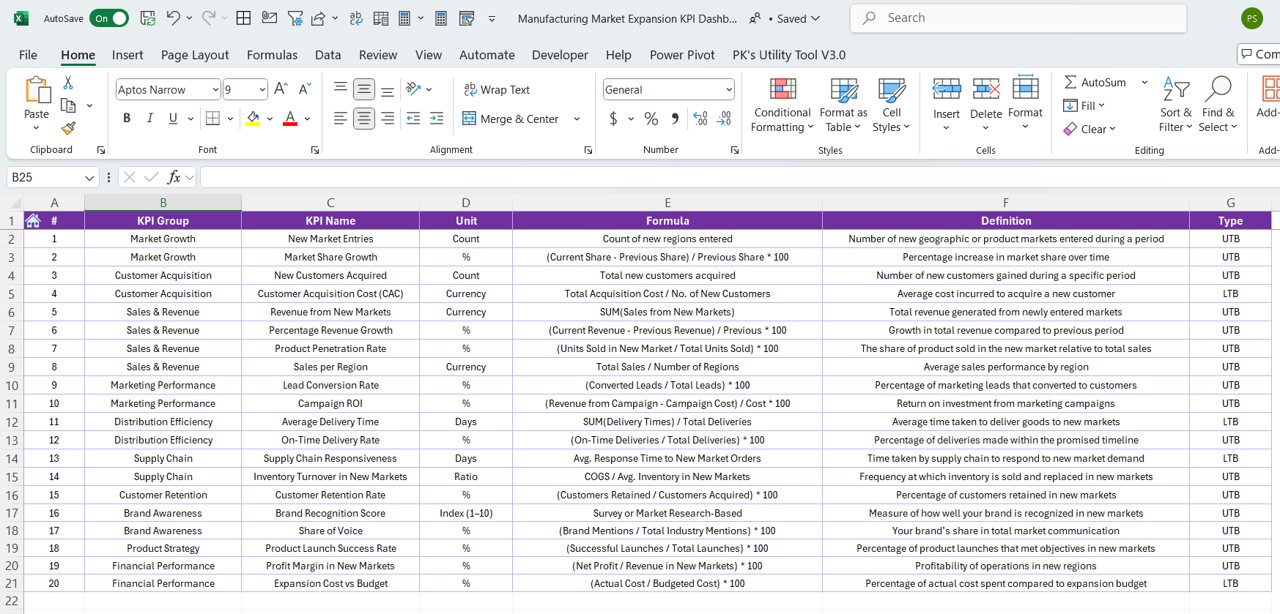
This tab serves as your KPI reference library. Add your KPI names, their group/category, measurement units, formula used, and their definition for better clarity.
Advantages of Using This Dashboard
Using this Excel dashboard comes with multiple benefits that make it a must-have tool for manufacturing companies:
✅ Real-Time Visibility: The dashboard provides a clear picture of current performance compared to past years and predefined targets. This helps you stay proactive rather than reactive.
✅ Customization Friendly: The spreadsheet is flexible. You can add or remove KPIs easily based on your business needs without the need for a developer.
✅ One-Click Navigation: With the clickable home sheet, you can jump between different sheets without scrolling through endless tabs.
✅ Easy Trend Analysis: Charts on the KPI Trend sheet help identify performance patterns, improvements, or declines, making forecasting more accurate.
✅ Monthly & Yearly Insights: With both MTD and YTD data points, you can make better monthly reviews and yearly strategic decisions.
Key KPIs for Manufacturing Market Expansion
If you’re not sure which KPIs to include, here are some important ones to consider:
- New Market Entry Rate
- Revenue from New Regions
- Sales Growth by Region
- Production Volume Increase
- Market Share %
- Customer Acquisition Rate
- Product Delivery Timeliness
- Cost per New Customer Acquired
- Each of these KPIs helps you understand how well your manufacturing operations are supporting market growth.
Best Practices for Using the Manufacturing KPI Dashboard
To make the most of your Excel dashboard, follow these proven best practices:
- Update Data Regularly: Make it a habit to input actual numbers at the end of each month. This keeps your analysis accurate and timely.
- Stick to Clear KPI Definitions: Use the KPI Definition sheet wisely. Ensure each KPI has a clear description and unit of measurement.
- Use Visual Indicators: Conditional formatting (like arrows or color codes) is already built-in. But feel free to enhance this to draw instant attention to dips or spikes.
- Validate Your Inputs: Always double-check the input sheets for typos or wrong values. Even a small mistake can skew the results on the dashboard.
- Share with Teams: Don’t keep this tool to yourself. Share the file with department heads or team leaders so everyone is aligned.
Conclusion
Click to Purchase Manufacturing Market Expansion KPI Dashboard in Excel
The Manufacturing Market Expansion KPI Dashboard in Excel is a powerful tool that transforms raw data into smart insights. From monthly tracking to yearly comparison, and from trend analysis to KPI definitions, it has everything you need to make informed decisions.
❓ Frequently Asked Questions (FAQs)
🔸 What is the purpose of this KPI Dashboard?
The dashboard helps manufacturers track performance metrics related to market expansion in real time using monthly and yearly data.
🔸 Can I add or remove KPIs from the dashboard?
Yes, you can easily add or remove KPIs by updating the KPI Definition and input sheets. It’s flexible and fully editable.
🔸 Does this dashboard support multiple years of data?
Absolutely! You can maintain historical data by adjusting the year in the input sheets and analyzing trends accordingly.
🔸 Can I use this dashboard for regions or products?
Yes! Just structure your KPIs by region or product category in the input sheets, and the dashboard will reflect the performance accordingly.
🔸 Do I need Excel expertise to use this?
Not at all. If you know basic Excel—how to enter data and use dropdowns—you can easily navigate and update the dashboard.
🔸 Is this dashboard suitable for small manufacturers?
Definitely. Whether you’re a small business or a multinational manufacturer, this dashboard can scale with your needs.
Click to Purchase Manufacturing Market Expansion KPI Dashboard in Excel
Visit our YouTube channel to learn step-by-step video tutorials