Tracking manufacturing performance is crucial for any production-based business. But instead of relying on multiple spreadsheets and manual reports, you can simplify everything with a Manufacturing Performance KPI Dashboard in Excel. This article will walk you through everything you need to know about this dashboard, including its benefits, structure, best practices, and frequently asked questions.
What Is a Manufacturing Performance KPI Dashboard?
A Manufacturing Performance KPI Dashboard is a visual representation of key performance indicators (KPIs) used to monitor and manage manufacturing operations. It combines data from various areas such as production, efficiency, quality, and targets—all in one place. Built in Excel, this tool becomes highly customizable and easy to use for day-to-day reporting.
Click to Purchase Manufacturing Performance KPI Dashboard in Excel
Why Use Excel for Manufacturing Dashboards?
Excel offers a flexible, cost-effective, and user-friendly environment. It requires no coding and is accessible to most professionals. With simple formulas, conditional formatting, and charts, Excel turns raw data into dynamic insights.
Structure of the Manufacturing Performance KPI Dashboard
This Excel-based dashboard consists of 7 well-organized worksheets, each serving a specific purpose:
Home Sheet
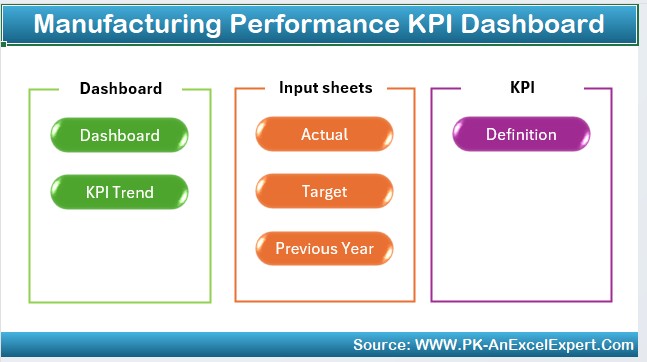
- Acts as an index page.
- Contains 6 clickable buttons that take users to respective sheets.
- Makes navigation simple and quick.
Dashboard Sheet Tab
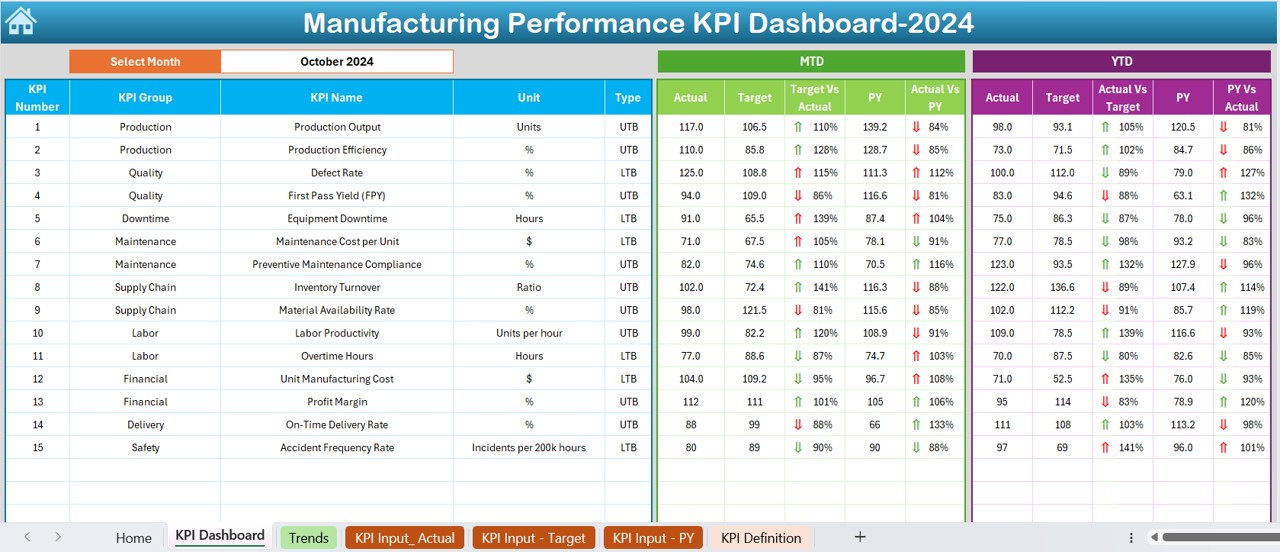
- Main visual area where all KPIs are displayed.
- Allows users to select the month via a dropdown in cell D3.
- Displays MTD (Month-To-Date) and YTD (Year-To-Date) metrics.
- Shows comparisons with target and previous year.
- Uses conditional formatting arrows to highlight improvement or decline.
KPI Trend Sheet Tab
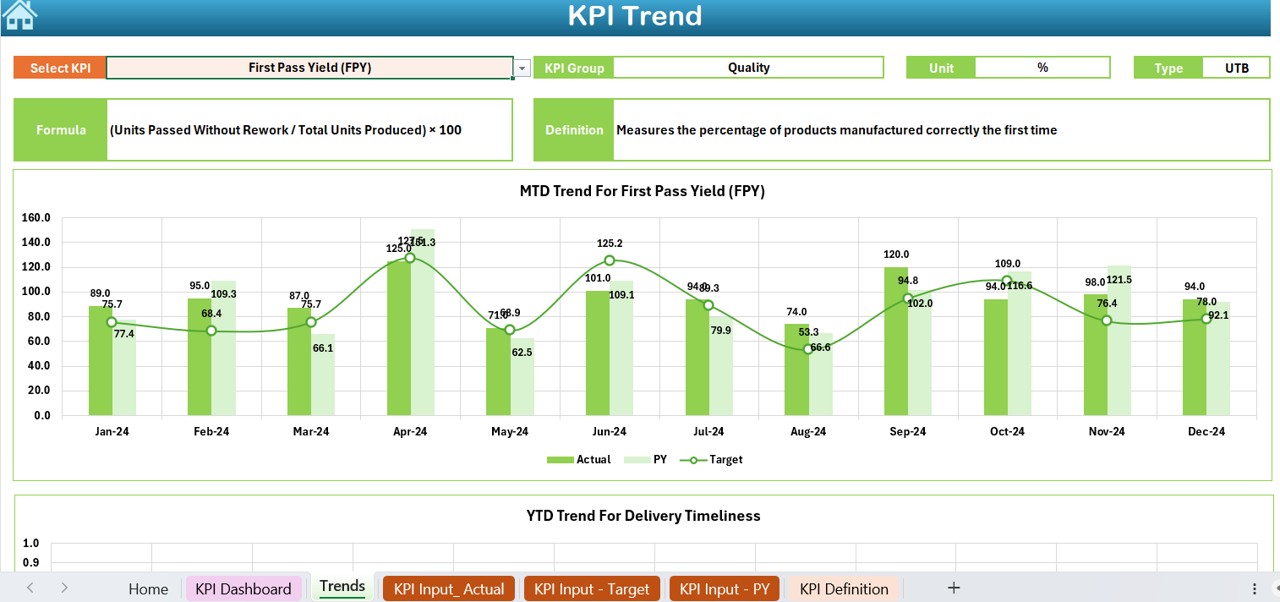
Allows KPI selection from a dropdown menu in cell C3.
Shows:
- KPI Group
- Unit of KPI
- Type (Lower or Upper is better)
- Formula
- Definition
- Includes MTD and YTD trend charts for:
- Actual
- Target
- Previous Year data
Click to Purchase Manufacturing Performance KPI Dashboard in Excel
Actual Numbers Input Sheet
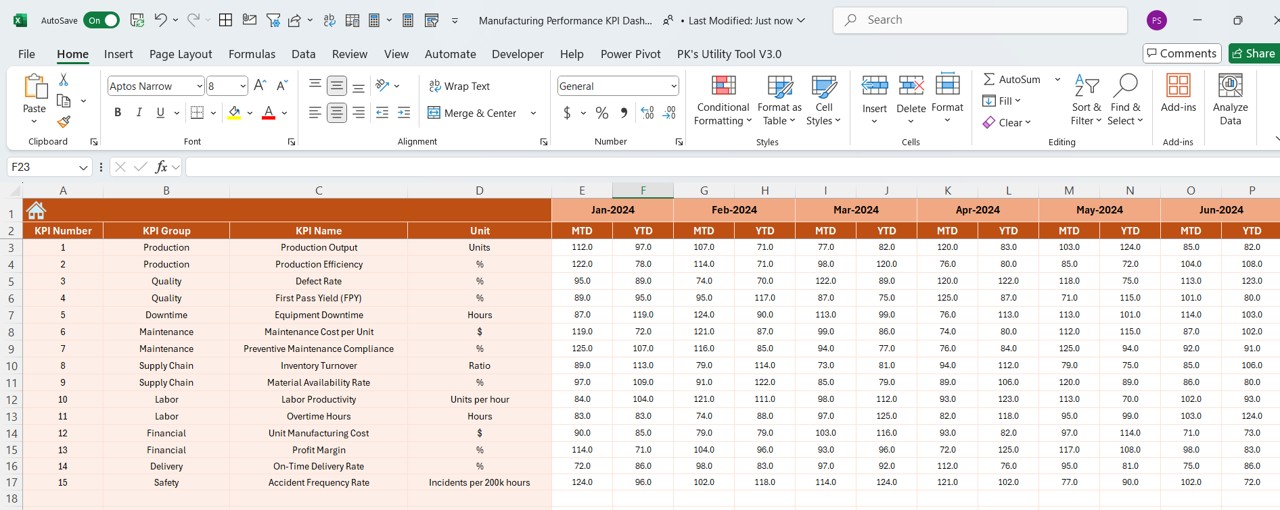
- Manual entry area for actual MTD and YTD data.
- Month can be set from cell E1.
- Easy to update and maintain.
Target Sheet Tab
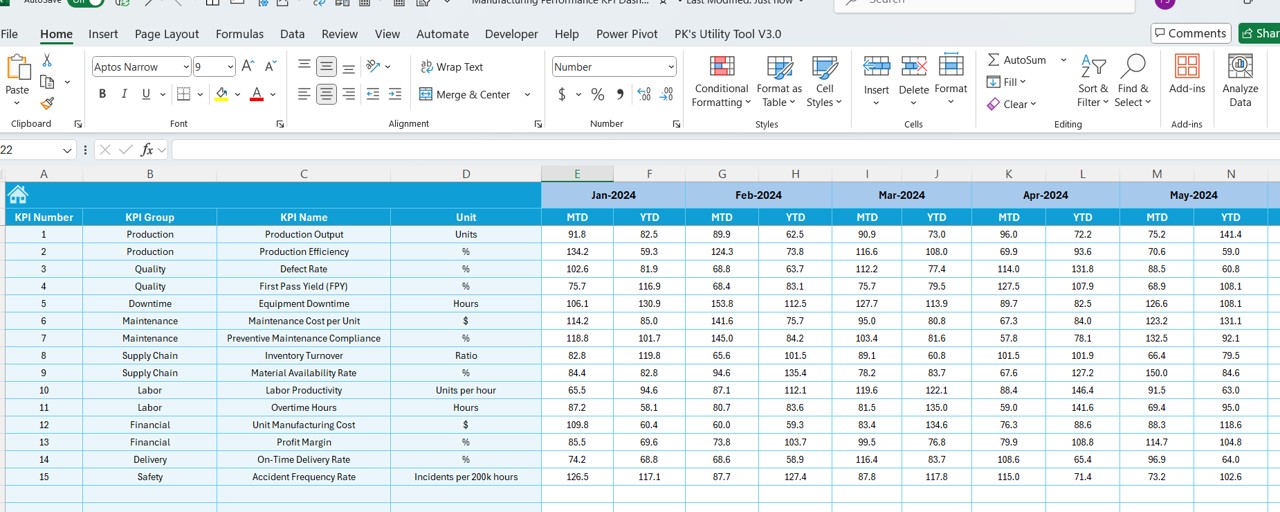
- Enter the monthly target values for each KPI.
- Supports both MTD and YTD input.
Previous Year Number Sheet
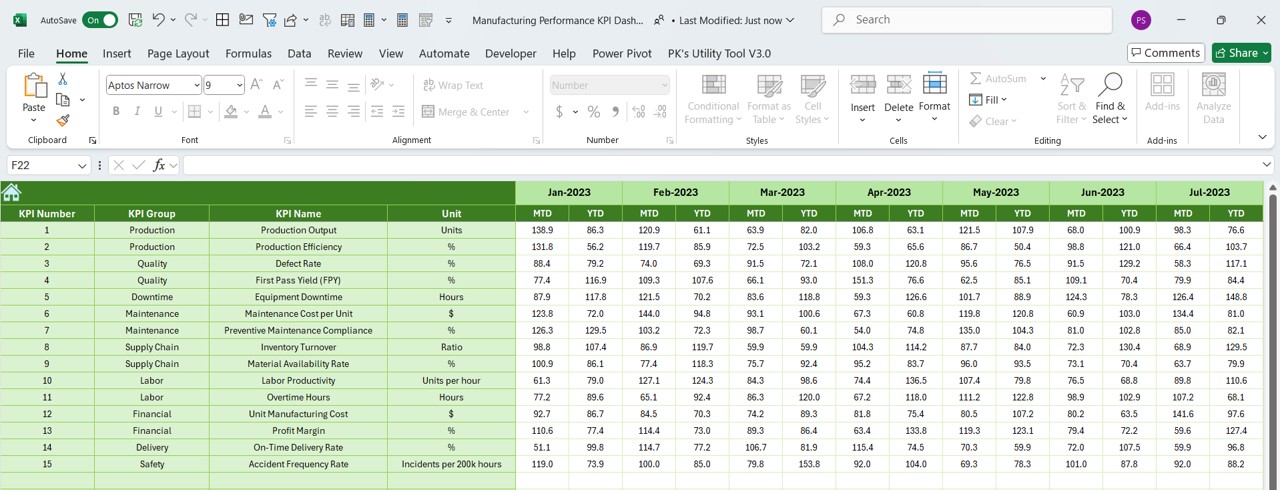
- Stores last year’s values for the same KPIs.
- Helps with historical performance comparison.
KPI Definition Sheet
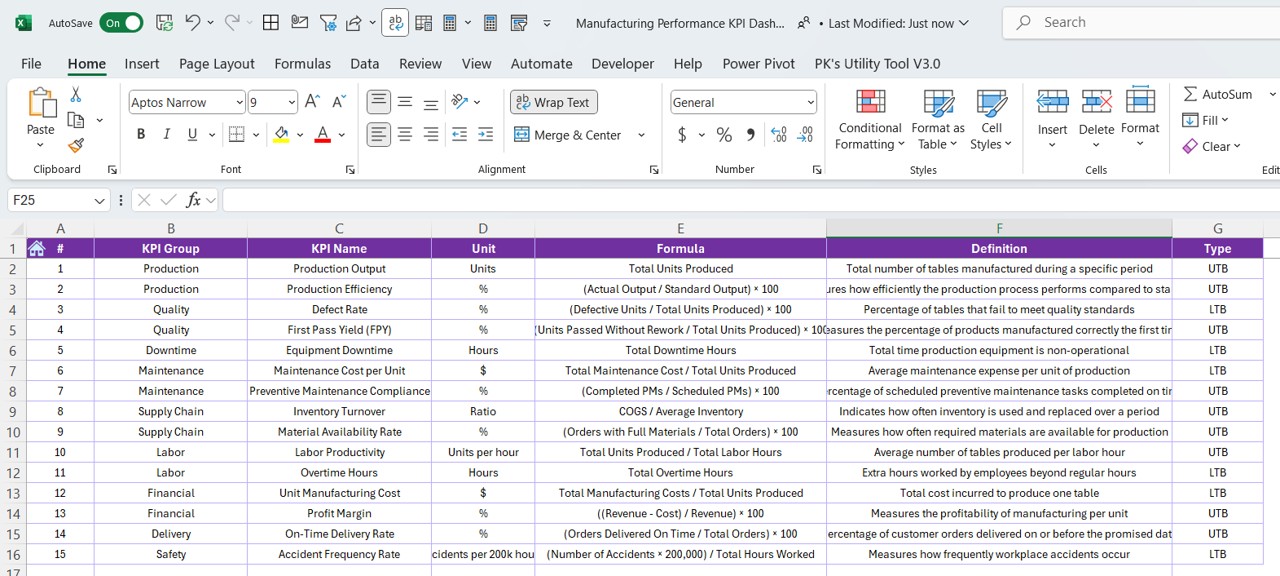
- Record detailed KPI information:
- Name
- Group
- Unit
- Formula
- Description
- Helps users understand what each KPI means.
Advantages of the Manufacturing Performance KPI Dashboard in Excel
✅ Centralized Performance Tracking: Everything you need is in one file—no more hunting through scattered spreadsheets.
✅ Interactive and Dynamic: Dropdowns and formulas ensure real-time updates based on user selections.
✅ Easy Comparison: Instantly compare current performance with targets and previous years.
✅ Customizable and Scalable: You can add more KPIs or modify formulas as per your business needs.
✅ Visual Insights: Color-coded arrows, charts, and graphs make data interpretation effortless.
Best Practices for Using the Manufacturing KPI Dashboard
Following these best practices will help you get the most out of your dashboard:
- Keep the Data Consistent: Ensure all inputs—actual, target, and historical—use the same units and formats.
- Update Regularly: Update actual and target values every month to keep reports current.
- Avoid Overloading the Dashboard: Stick to high-impact KPIs. Too many metrics can lead to confusion.
- Train Your Team: Make sure every team member understands how to use and interpret the dashboard.
Conclusion
The Manufacturing Performance KPI Dashboard in Excel is a practical, cost-effective, and smart solution for tracking your factory’s performance. Whether you’re a plant manager or a data analyst, this tool can save you time, reduce errors, and offer critical insights into your operations. Best of all, it’s user-friendly and highly customizable.
Start using this Excel dashboard today to transform your manufacturing data into decisions that drive growth and efficiency.
Frequently Asked Questions (FAQs)
Q1. Can I add more KPIs to the dashboard?
Yes, the template is fully editable. You can insert new KPIs, but remember to update the relevant formulas and charts.
Q2. Do I need advanced Excel skills to use it?
No, basic knowledge of Excel formulas and navigation is enough. The template is designed for ease of use.
Q3. Can I track daily data with this dashboard?
The current setup is month-based. However, you can tweak the design to include daily entries.
Q4. How do I print or share this dashboard?
You can export the dashboard sheet as a PDF or print it directly from Excel.
Q5. Is this dashboard suitable for small manufacturing units?
Absolutely. The dashboard is scalable and works well for both small and large operations.
Click to Purchase Manufacturing Performance KPI Dashboard in Excel
Visit our YouTube channel to learn step-by-step video tutorials