When it comes to improving manufacturing processes, tracking the right metrics is the game-changer. You can’t improve what you don’t measure. That’s why every manufacturing team needs a simple, clear, and effective way to monitor progress and make data-driven decisions. In this article, we’ll explore a powerful tool designed exactly for that — the Manufacturing Process Improvement KPI Dashboard in Excel.
Let’s dive into everything you need to know about this dashboard — how it works, what makes it useful, best practices to follow, and answers to your most pressing questions.
Click to Purchase Manufacturing Process Improvement KPI Dashboard in Excel
What is a Manufacturing Process Improvement KPI Dashboard?
A Manufacturing Process Improvement KPI Dashboard is a performance monitoring tool that gives you real-time insights into how well your production process is doing. It collects data from different KPIs (Key Performance Indicators) like production efficiency, defect rates, downtime, throughput, and more — then visualizes that data for quick and easy decision-making.
When built in Excel, this dashboard becomes even more powerful because you don’t need expensive software or complex training. It’s simple, flexible, and cost-effective.
Overview of the Manufacturing Process Improvement KPI Dashboard in Excel
We’ve designed a ready-to-use Excel template that helps manufacturers track, analyze, and improve their performance across key areas. The dashboard contains 7 organized worksheets, each serving a unique purpose.
Home Sheet – Your Navigation Hub
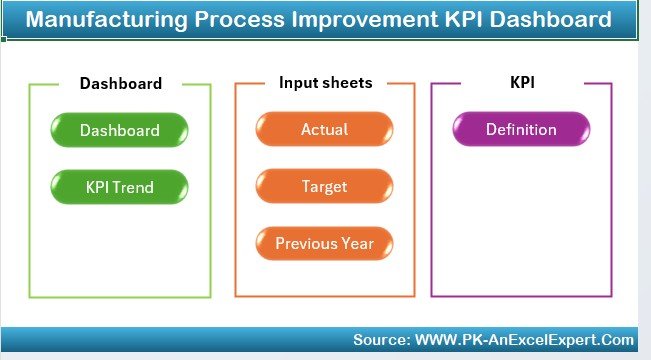
This is your command center. The Home Sheet provides an index with clickable buttons that help you jump directly to the other sheets.
✅ No more scrolling endlessly to find the right tab.
✅ Just click and go — it’s smooth and time-saving.
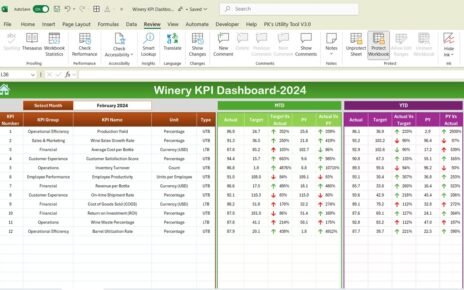
Dashboard Sheet – Complete Performance Snapshot
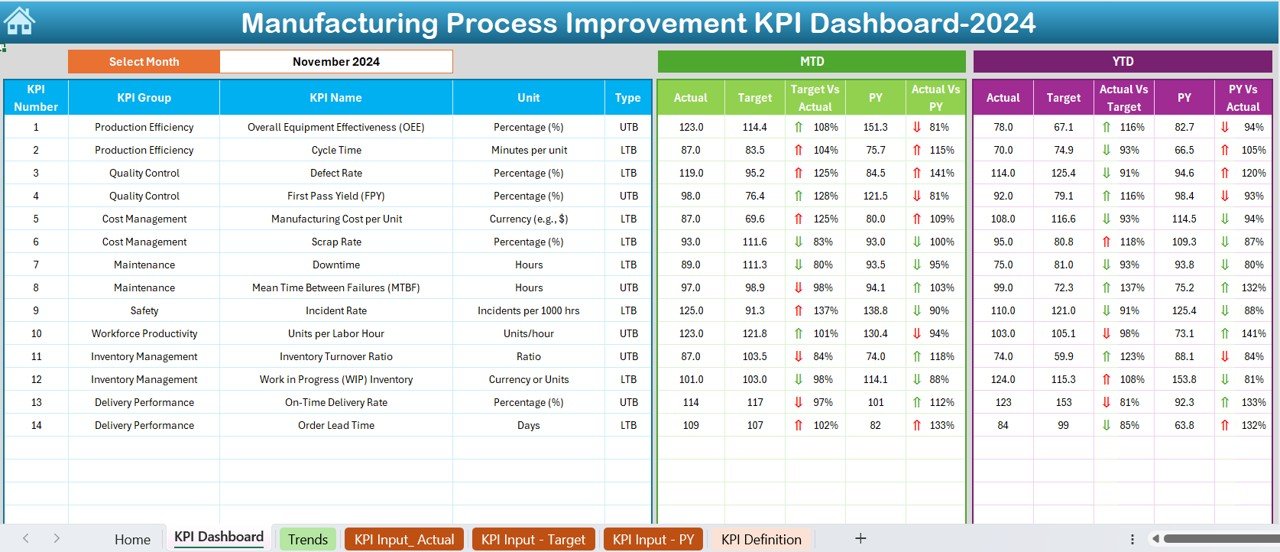
This is the heart of the tool. In the Dashboard tab, you get a full overview of every KPI across:
- Month-to-Date (MTD)
- Year-to-Date (YTD)
- Target
- Previous Year (PY)
And here’s the best part — everything changes dynamically based on the selected month (cell D3). Once you choose the month, all metrics update instantly.
Visual cues like up and down arrows with conditional formatting make it super easy to compare actual vs. target and actual vs. last year’s numbers.
KPI Trend Sheet – In-Depth Performance Analysis
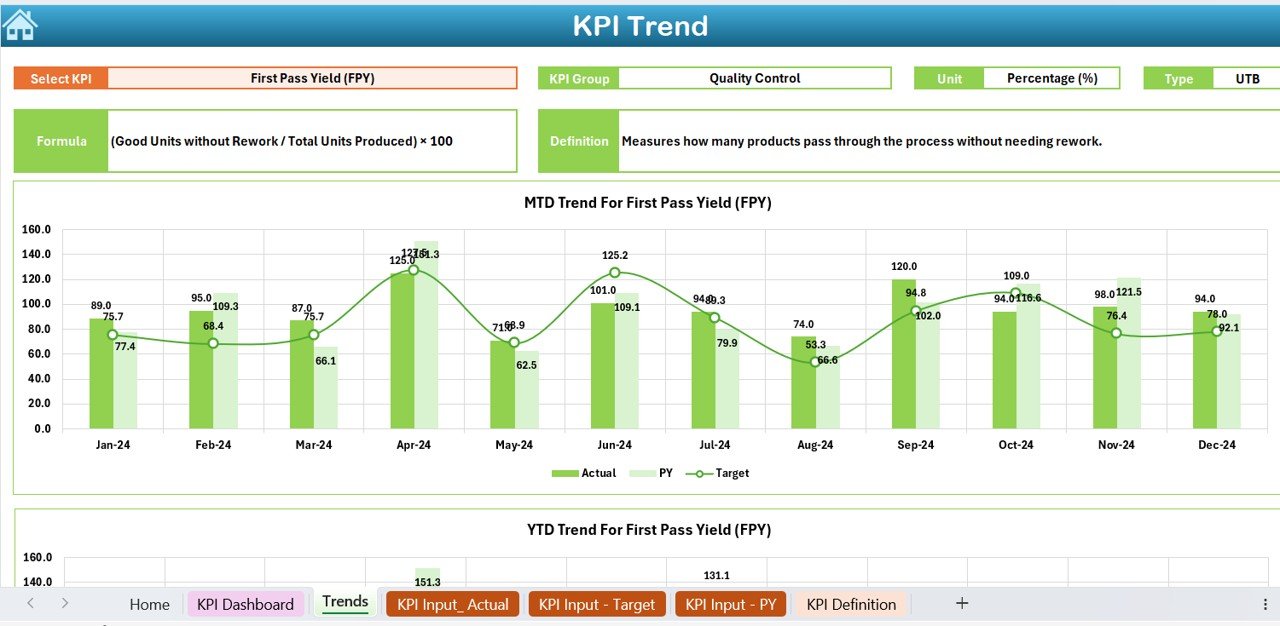
Want to dive deeper into specific metrics? The KPI Trend Sheet is where you go.
Choose a KPI from the dropdown in cell C3, and the sheet will display:
- KPI Group
- KPI Unit
- KPI Type (Upper or Lower is better)
- Formula
- Definition
It also provides trend charts for MTD and YTD — perfect for visual learners and data analysts alike.
Click to Purchase Manufacturing Process Improvement KPI Dashboard in Excel
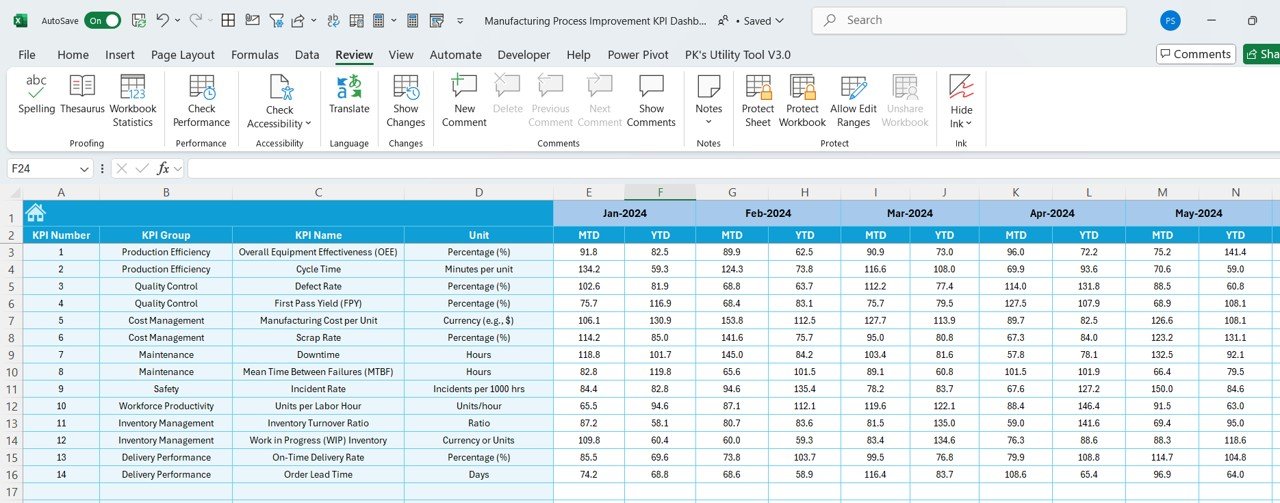
Actual Numbers Input – Feed Your Data
This is where you enter your actual performance numbers.
- Enter MTD and YTD figures based on your operational data.
- Change the month (cell E1) and input values accordingly.
- This keeps the dashboard dynamic and accurate.
- Simple interface, no coding, just pure data entry.
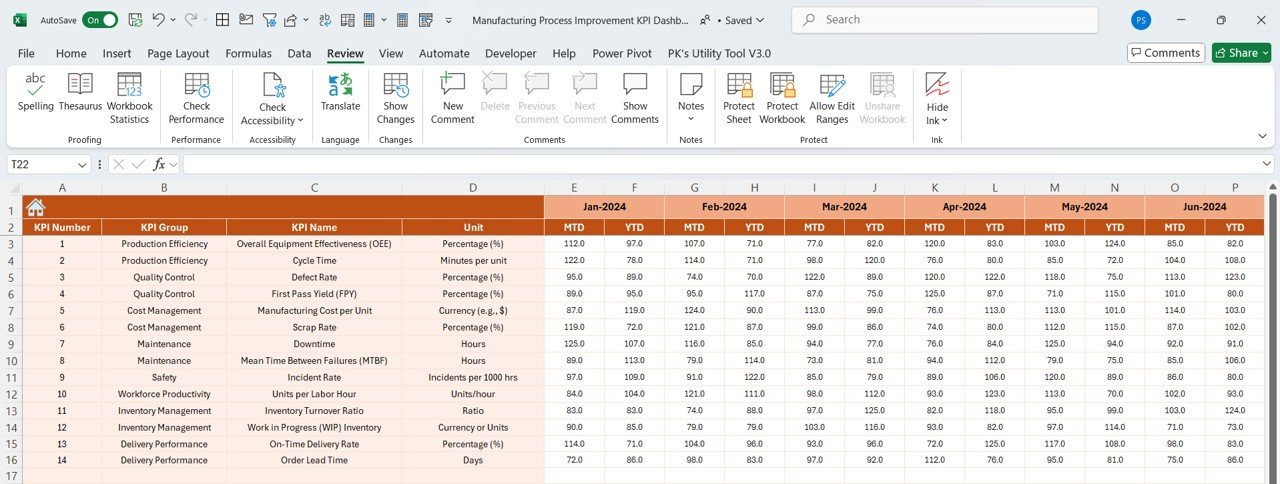
Target Sheet – Define Your Goals
In this tab, you input the target values for each KPI — both MTD and YTD. These targets serve as benchmarks, helping you understand how well you’re doing at any given point.
Setting monthly and yearly targets improves accountability and strategic planning.
Previous Year Numbers – Benchmark Your Growth
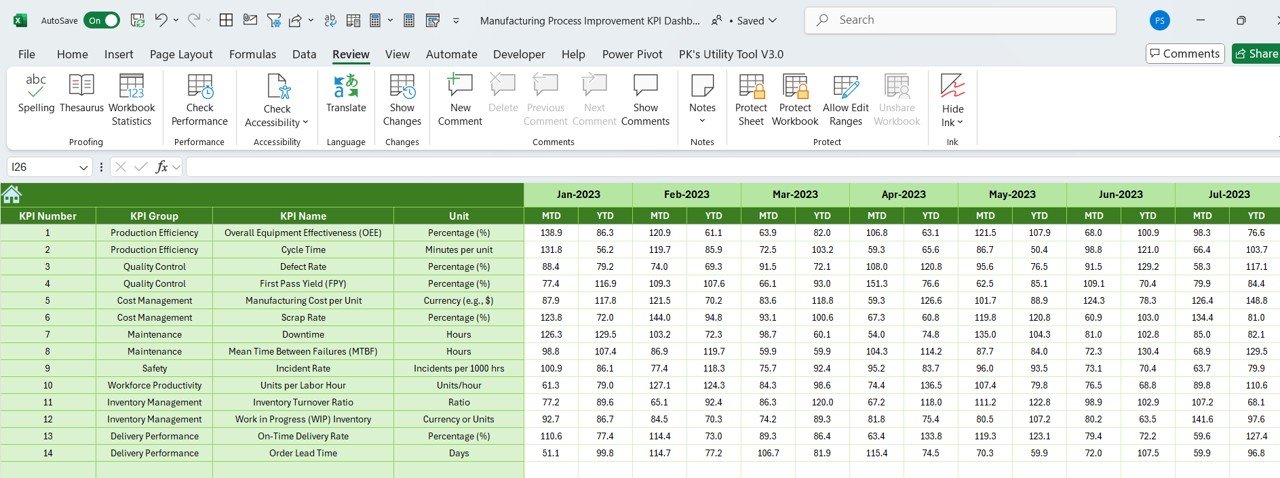
The Previous Year Sheet allows you to input the last year’s performance data. This is incredibly useful for measuring year-over-year improvements.
- Are you reducing downtime?
- Improving throughput?
- You’ll find out right here.
KPI Definition Sheet – Understand What You’re Tracking
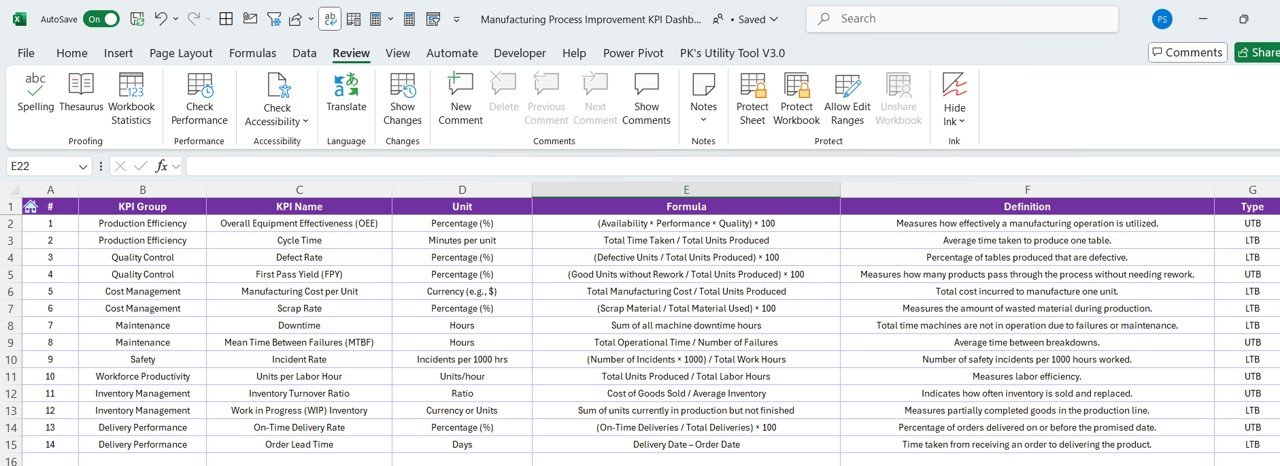
Every KPI needs to be clearly defined. This sheet contains:
- KPI Name
- KPI Group
- Unit of Measurement
- Formula
- Definition
This ensures that everyone on your team speaks the same language and understands what each KPI means.
Advantages of Using the KPI Dashboard in Excel
✅ Real-Time Monitoring: You can track performance at any time — just change the month and the whole dashboard updates.
✅ Easy to Use: No need for expensive tools or technical know-how. Anyone who knows Excel can use this.
✅ Better Decision-Making: See where you’re underperforming and where you’re winning. Make changes fast and smart.
✅ Standardized KPI Definitions: Keep the entire team aligned with uniform definitions and formulas for every KPI.
✅ Historical Comparisons: Benchmark progress by comparing current performance with last year’s data.
Best Practices for the Manufacturing KPI Dashboard
To get the most out of your dashboard, follow these best practices:
- Update Your Data Regularly: Keep your actuals and targets fresh. Make it a weekly or monthly task.
- Use Clear Definitions: Everyone should understand what each KPI means. Avoid confusion by using the KPI Definition Sheet.
- Review Trends, Not Just Snapshots: Look beyond the current month. Study trends over time to find real insights.
- Set Realistic Targets: Don’t aim too high or too low. Use historical data to set meaningful, achievable targets.
- Communicate Results: Share the dashboard with your team. It improves transparency and motivates performance.
- Customize Based on Your Needs: This Excel dashboard is flexible. Add new KPIs or modify existing ones based on what your operation needs.
Why Choose Excel for Manufacturing KPIs?
You might wonder, “Why not use some fancy tool or ERP system?” Well, here’s why Excel still rocks:
- No additional software cost
- Easy integration with existing data
- Highly customizable
- Widespread familiarity
- Instant reporting capability
- Most small and mid-sized manufacturers don’t need complex systems. Excel gets the job done efficiently.
How to Use the Manufacturing KPI Dashboard
Here’s a quick step-by-step guide to start using your dashboard:
- Download the Template
- It’s ready-to-use. Just open the Excel file.
- Enter Actuals
- Go to the “Actual Numbers Input” sheet and enter MTD and YTD numbers.
- Set Your Targets
- Navigate to the “Target Sheet” and input your desired goals.
- Add Previous Year Data
- Fill in the same KPIs from last year for comparison.
- Review Trends
- Check the “KPI Trend” sheet to analyze patterns.
- Visualize Overall Performance
- Use the Dashboard tab to see performance in one view.
- Adjust and Improve
- Use the insights to take corrective actions and make improvements.
Conclusion
Improving manufacturing processes doesn’t have to be complicated or expensive. With the Manufacturing Process Improvement KPI Dashboard in Excel, you get an intuitive, data-driven, and action-focused solution right at your fingertips.
From monitoring monthly trends to setting realistic targets, this tool equips your team with everything it needs to succeed. Excel might be simple — but in the right hands, it’s extremely powerful.
So, are you ready to transform your shop floor with data? This dashboard is your first step toward consistent and measurable manufacturing success.
❓Frequently Asked Questions (FAQs)
Can I customize the KPI list in the dashboard?
Yes! You can easily add, edit, or remove KPIs in the KPI Definition and Input sheets. The dashboard is fully flexible.
Is this dashboard suitable for small manufacturers?
Absolutely. It’s perfect for small and medium-sized enterprises that don’t have access to expensive ERP systems.
Can I track daily data with this dashboard?
The current version is designed for MTD and YTD tracking, but you can tweak the sheets to track daily data as well.
Do I need Excel VBA or macros to use this dashboard?
No. This dashboard works with basic Excel features like formulas, drop-down lists, and conditional formatting. No macros are required.
How can I share this dashboard with my team?
You can share the Excel file directly or store it on a shared drive like OneDrive or Google Drive for team collaboration.
Click to Purchase Manufacturing Process Improvement KPI Dashboard in Excel
Visit our YouTube channel to learn step-by-step video tutorials