In today’s competitive manufacturing landscape, quality assurance plays a key role in ensuring consistent performance, product reliability, and customer satisfaction. One of the best ways to monitor and improve quality is by using a Manufacturing Quality Assurance KPI Dashboard in Excel. This ready-to-use dashboard template not only saves time but also provides clear visibility into quality metrics across different stages of the manufacturing process.
In this guide, we will walk you through everything you need to know about using this dashboard effectively, its key features, advantages, and best practices.
Click to Purchase Manufacturing Quality Assurance KPI Dashboard in Excel
What is a Manufacturing Quality Assurance KPI Dashboard?
A Manufacturing Quality Assurance KPI Dashboard is a visual management tool that helps track and analyze key performance indicators (KPIs) related to quality control. It helps managers and quality teams monitor performance at a glance, identify issues early, and take corrective actions quickly.
This dashboard in Excel has been carefully designed with automation, interactivity, and visual insights to simplify quality monitoring.
Key Features of the Manufacturing Quality Assurance KPI Dashboard
This Excel-based dashboard template includes seven structured worksheets, each with a specific purpose:
Home Sheet
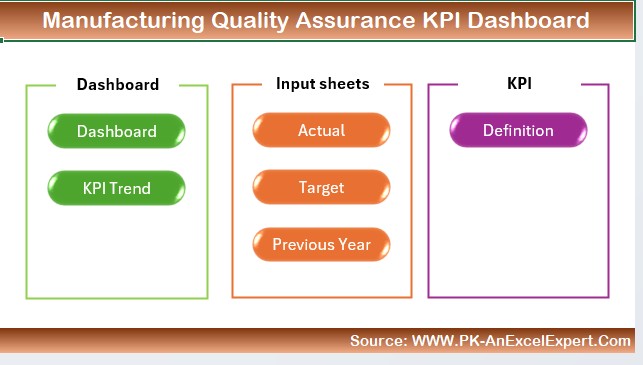
- Serves as the index sheet
- Contains 6 clickable buttons for easy navigation to different sheets
- Provides a clean and user-friendly start to your dashboard
Dashboard Sheet Tab
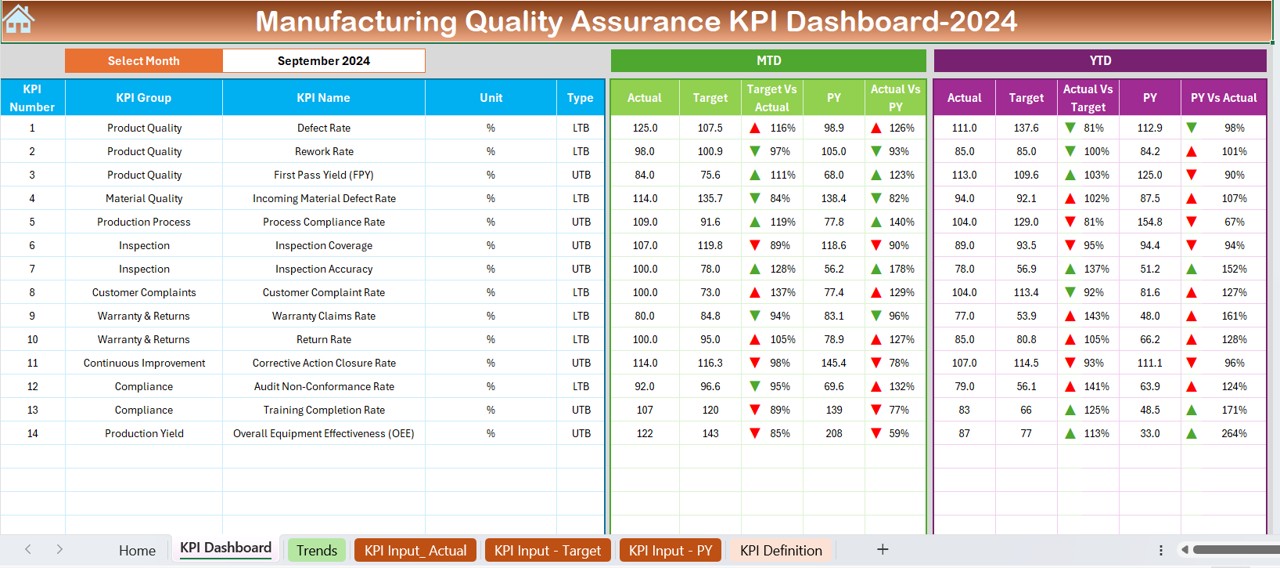
- The main reporting and visualization hub
- Select the month from a dropdown in cell D3
- View MTD (Month-To-Date) and YTD (Year-To-Date) data
Shows:
- Actual, Target, and Previous Year values
- Conditional formatting with up/down arrows
- Visual comparisons for Target vs Actual and PY vs Actual
KPI Trend Sheet Tab
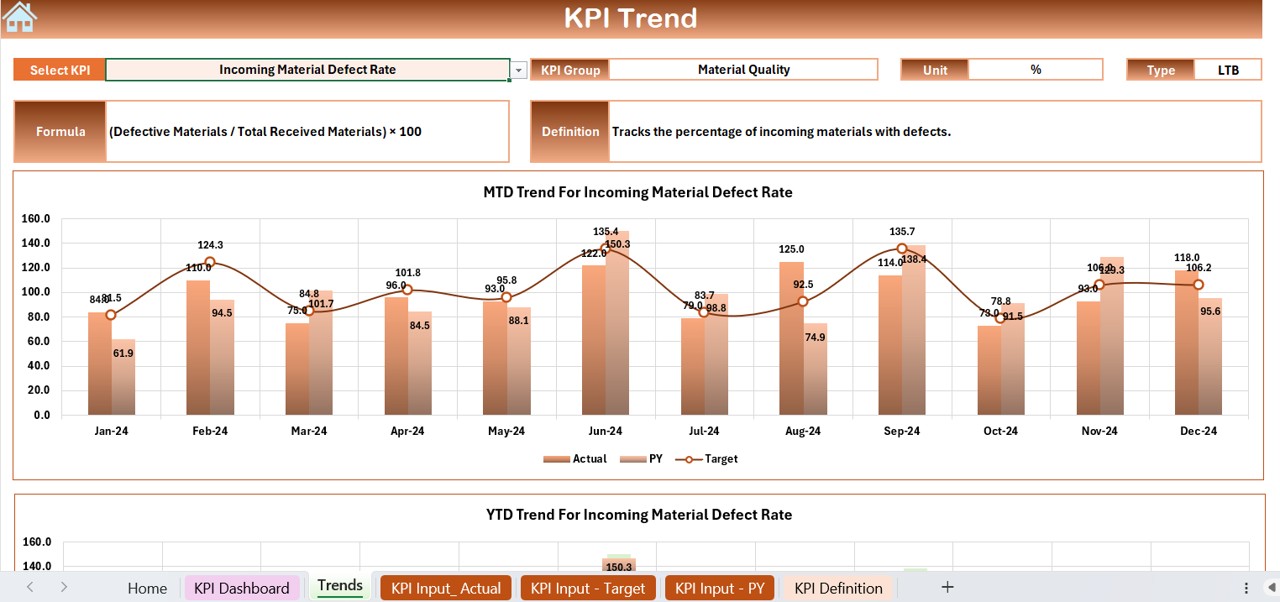
- Select KPI from dropdown in cell C3
Displays:
- KPI Group, Unit, Type (Upper/Lower the Better), Formula, and Definition
- Line charts showing MTD and YTD trends for Actual, Target, and PY
Actual Numbers Input Sheet
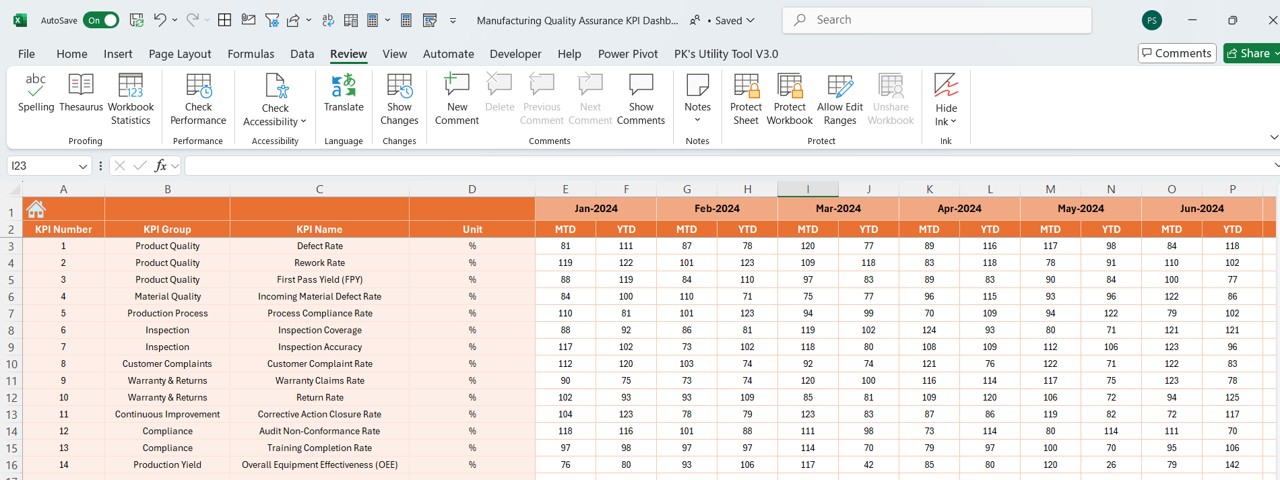
- Enter MTD and YTD actual data
- Choose the first month of the year in cell E1
- Data input is automated across the dashboard
Click to Purchase Manufacturing Quality Assurance KPI Dashboard in Excel
Target Sheet Tab
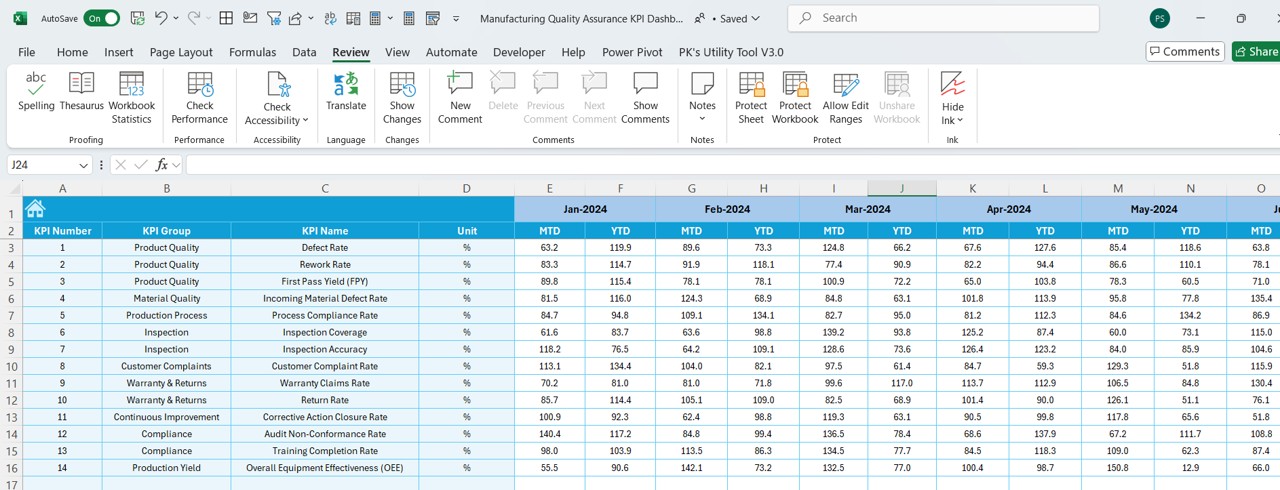
- Input target values for each KPI
- Supports both MTD and YTD target numbers
Previous Year Numbers Sheet Tab
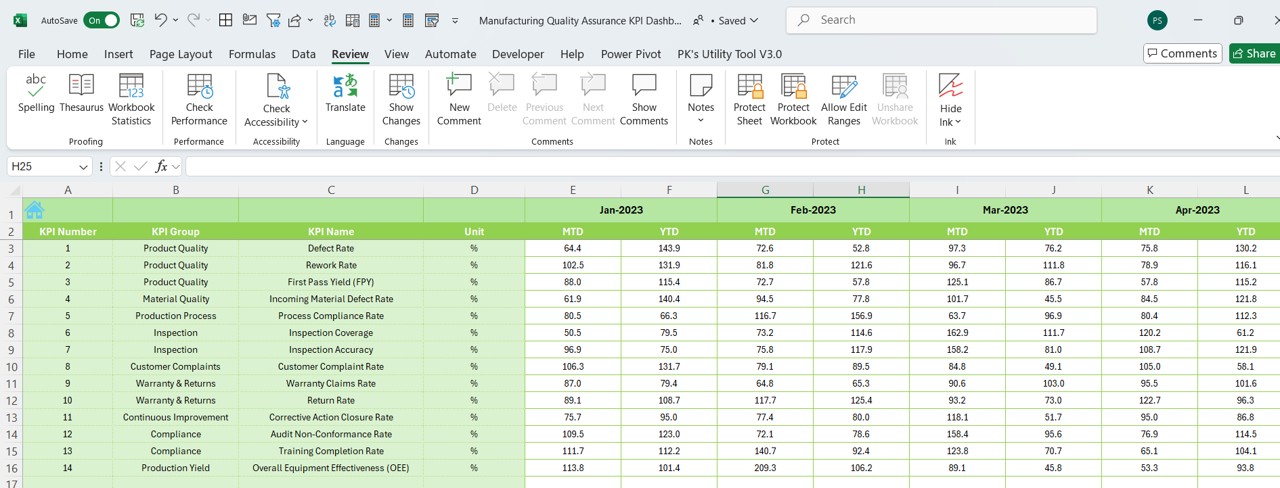
- Add actual performance data for the previous year
- Helps in comparing current metrics with past data
KPI Definition Sheet Tab
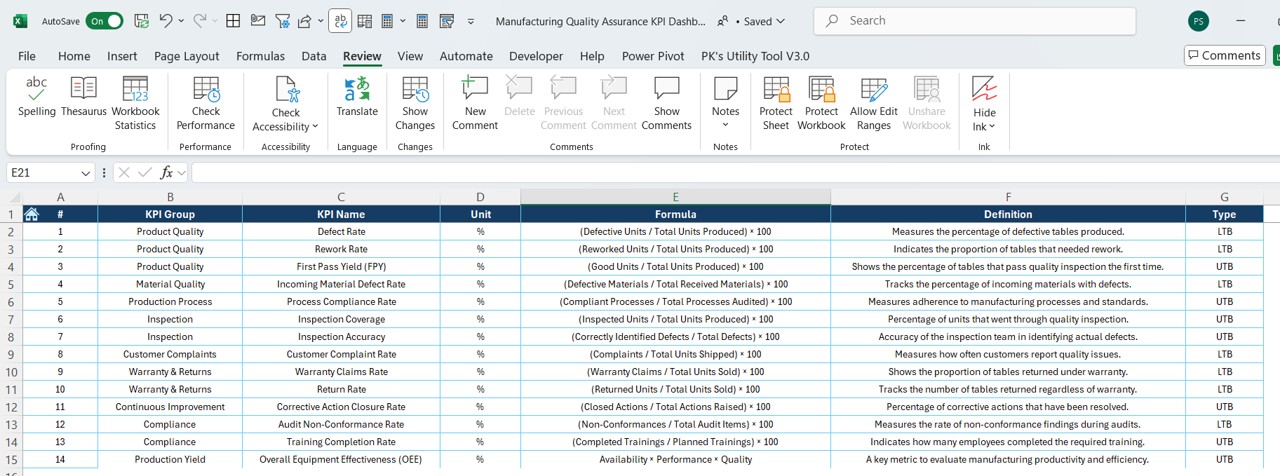
- Maintain a detailed list of KPIs with:
- Name, Group, Unit, Formula, and Definition
- Ensures transparency and standardization
Why Should You Use a Quality Assurance KPI Dashboard?
Here are a few reasons why you should consider using this dashboard in your manufacturing setup:
- Helps track quality trends in real-time
- Enables quick decision-making based on data
- Reduces the risk of non-conformities
- Keeps everyone on the same page
- Simplifies monthly and yearly reporting
Advantages of Using This Excel KPI Dashboard
🔹 Easy to Use: No complex software or coding knowledge is required. Anyone familiar with Excel can use this dashboard.
🔹 Customizable: You can update KPIs, change units, adjust targets, and personalize visuals to match your organization’s goals.
🔹 Interactive Elements: Dropdown menus, conditional formatting, and auto-updating charts make data interaction seamless.
🔹 Instant Insights: The dashboard provides visual cues (like up/down arrows) and comparative metrics that make it easier to interpret data.
🔹 Time-Saving: All sheets are linked. Once you input your data, the dashboard updates automatically. No need to calculate KPIs manually.
✅ Best Practices for Using the Manufacturing KPI Dashboard
To get the most out of your KPI Dashboard, follow these best practices:
- Define Clear KPIs: Start with a clear list of KPIs that matter for quality. Use the KPI Definition Sheet to set up each one.
- Ensure Accurate Data Entry: Always double-check the numbers you enter. Mistakes in actuals or targets can lead to incorrect conclusions.
- Update Monthly: Make it a routine to update MTD and YTD values at the end of each month.
- Use Trends to Predict Issues: Look at the KPI Trend sheet to identify patterns before they become problems.
- Keep It Clean: Avoid unnecessary formatting or clutter. A clean dashboard is easier to read and understand.
📚 Conclusion
If you’re serious about improving product quality and process efficiency in your manufacturing unit, then this Manufacturing Quality Assurance KPI Dashboard in Excel is a must-have tool. It gives you the clarity and control needed to stay on top of your quality goals.
With an intuitive design, actionable insights, and all key data in one place, you’ll be empowered to make smarter decisions and drive better outcomes every single month.
Frequently Asked Questions (FAQs)
Can I use this dashboard without Excel expertise?
Yes, absolutely! The dashboard is beginner-friendly and doesn’t require advanced Excel knowledge.
Can I customize the KPIs based on my industry?
Definitely. You can edit the KPI Definition sheet to add or remove KPIs as per your requirements.
How do I update the dashboard each month?
Just input the new actuals and targets for the month in the respective sheets. The dashboard updates automatically.
Can I add more charts or visuals to the dashboard?
Yes. You can add new visuals in the Dashboard or KPI Trend tab by using Excel’s built-in chart features.
Does this dashboard support year-over-year comparison?
Yes, it shows both Target vs Actual and Previous Year vs Actual comparisons for MTD and YTD.
Is this template printable?
Yes, you can print any sheet or export the dashboard to PDF for reporting purposes.
Click to Purchase Manufacturing Quality Assurance KPI Dashboard in Excel
Visit our YouTube channel to learn step-by-step video tutorials