In today’s highly regulated manufacturing environment, staying compliant with industry regulations is not just a legal necessity—it’s a strategic imperative. Manufacturers must continuously track their adherence to policies, safety standards, and quality norms to maintain certifications, avoid penalties, and uphold brand reputation. But how do you simplify this tracking process? The answer lies in a powerful, user-friendly tool: the Manufacturing Regulatory Adherence KPI Dashboard in Excel.
This dashboard is not just another spreadsheet—it’s a complete regulatory compliance solution built to monitor key performance indicators (KPIs) that matter the most.
Click to Purchase Manufacturing Regulatory Adherence KPI Dashboard in Excel
What Is the Manufacturing Regulatory Adherence KPI Dashboard in Excel?
The Manufacturing Regulatory Adherence KPI Dashboard is a dynamic Excel-based tool designed to help manufacturing units monitor and manage their compliance performance. From safety incidents and audit results to regulatory breaches and documentation accuracy, this dashboard gives a 360-degree view of compliance health.
It allows users to track:
- MTD (Month-to-Date) and YTD (Year-to-Date) performance
- Actual vs Target data
- Previous Year comparisons
- Detailed KPI trends with charts
With a simple dropdown interface, users can select any month to instantly view updated insights and take corrective actions if needed.
Key Features of the Manufacturing Regulatory Adherence KPI Dashboard
This Excel-based dashboard includes seven fully functional worksheets, each playing a critical role:
Home Sheet
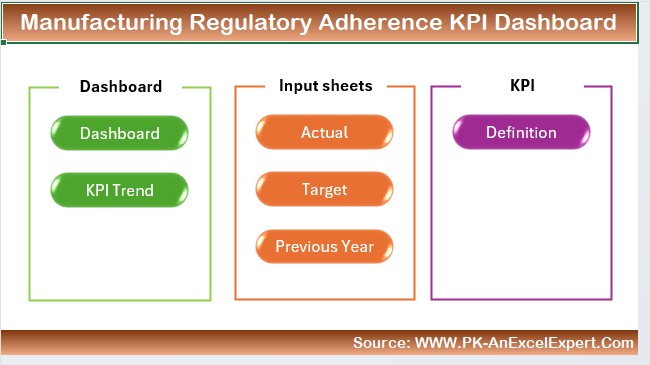
- Acts as the main index page
- Includes navigation buttons to jump to any sheet instantly
- Clean and professional layout for ease of use
Dashboard Sheet
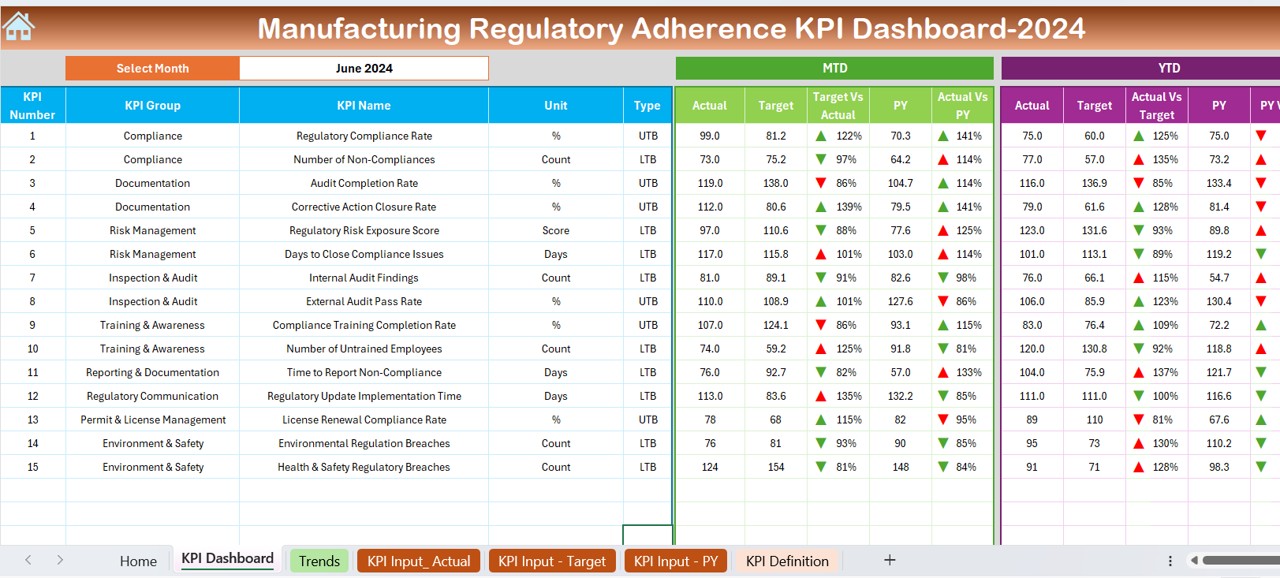
Select a month using the dropdown in cell D3
Automatically displays:
- MTD Actual, Target, Previous Year values
- YTD Actual, Target, Previous Year values
- Visual indicators like up/down arrows for trends
KPI Trend Sheet
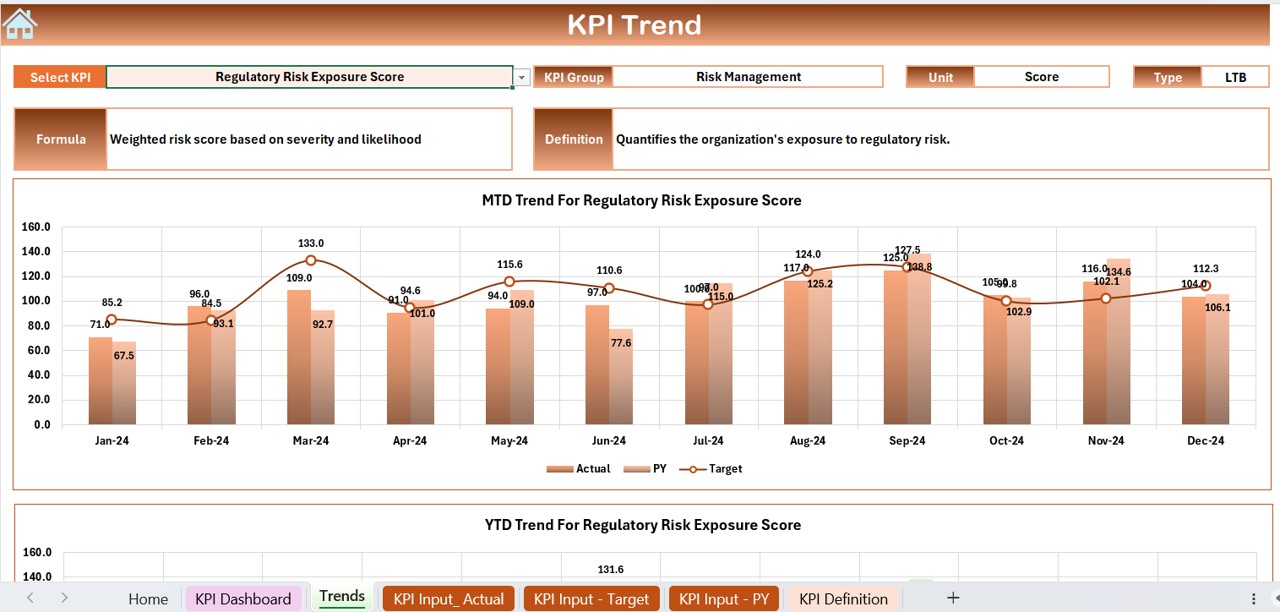
Dropdown list to select any KPI (Cell C3)
Shows:
- KPI Group
- Unit of Measurement
- Formula
- Type (Upper the Better / Lower the Better)
- Definition
- Includes MTD and YTD trend charts
Click to Purchase Manufacturing Regulatory Adherence KPI Dashboard in Excel
Actual Numbers Input Sheet
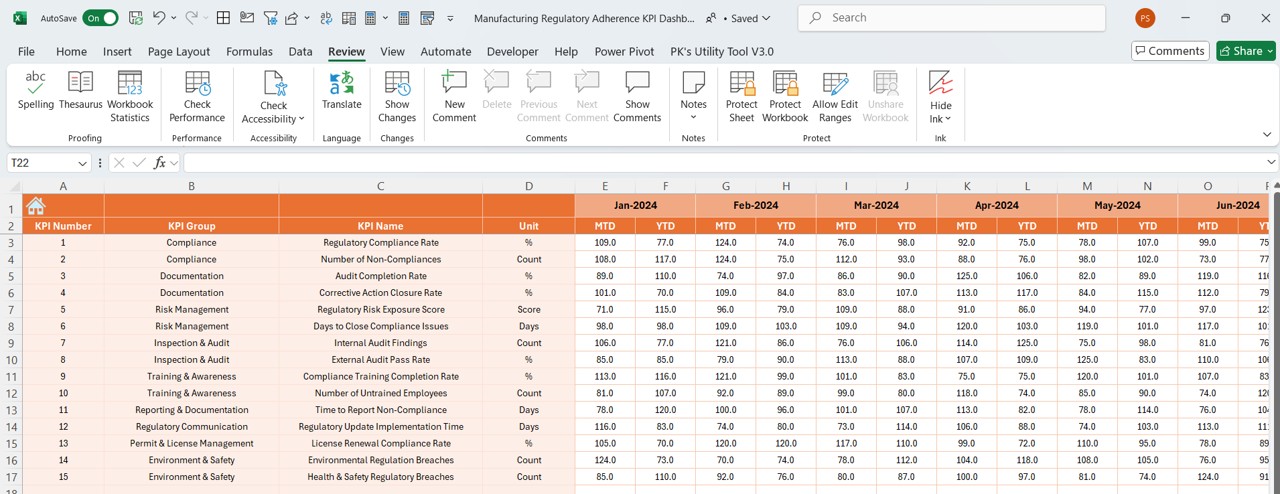
- User inputs actual data month-wise
- Change the fiscal starting month via Cell E1
Target Sheet
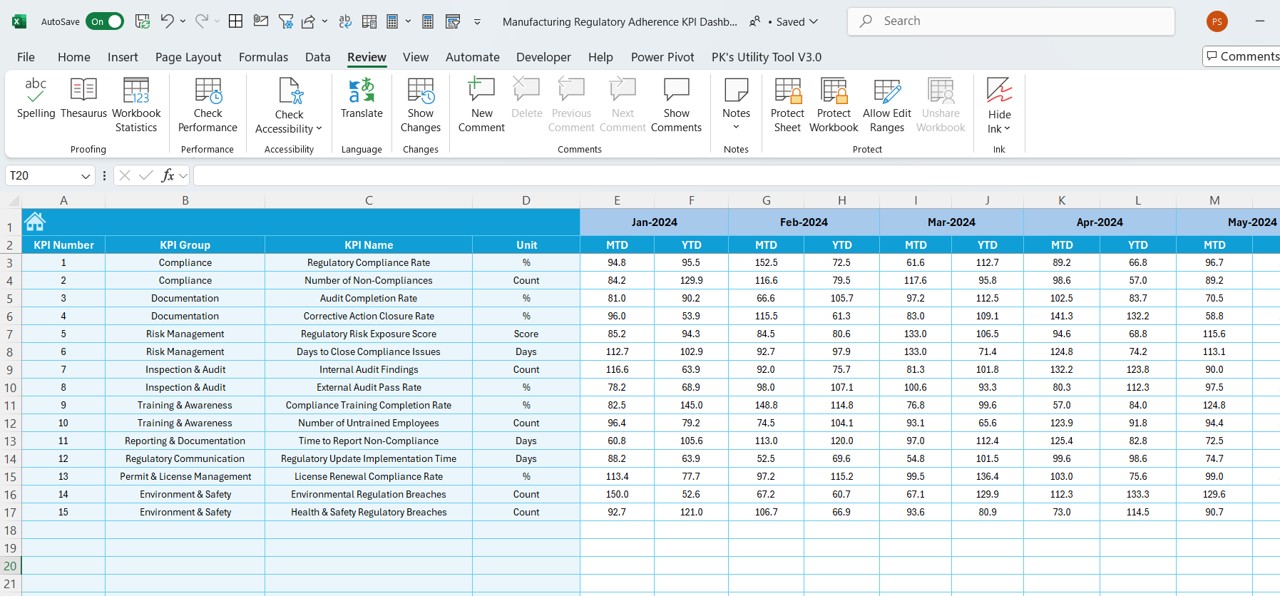
- Enter monthly and yearly targets for each KPI
Previous Year Numbers Sheet
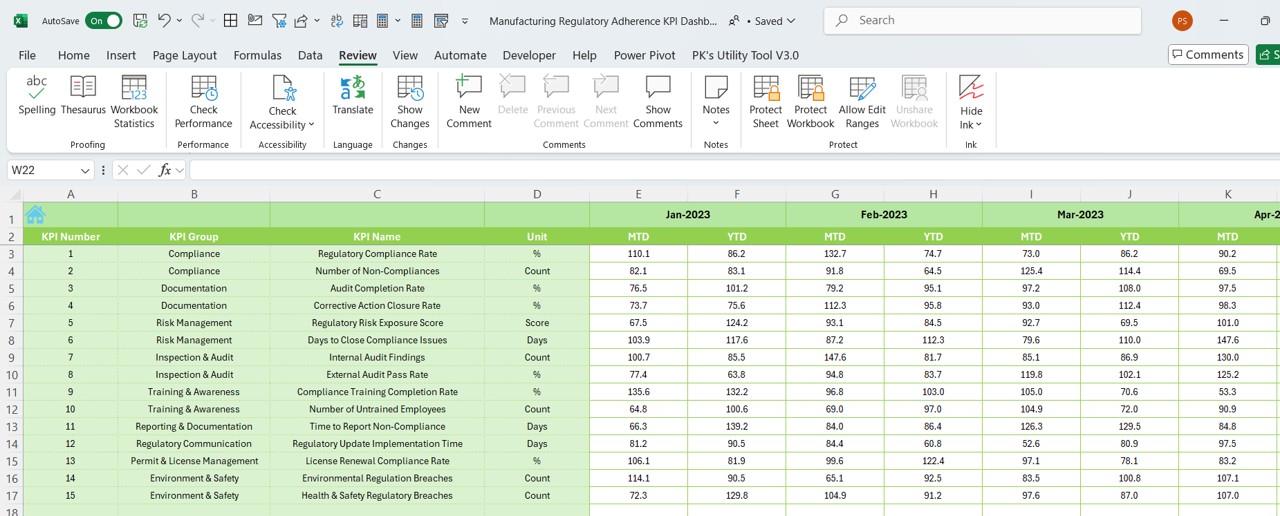
- Enter historical data to track progress and trend over time
KPI Definition Sheet
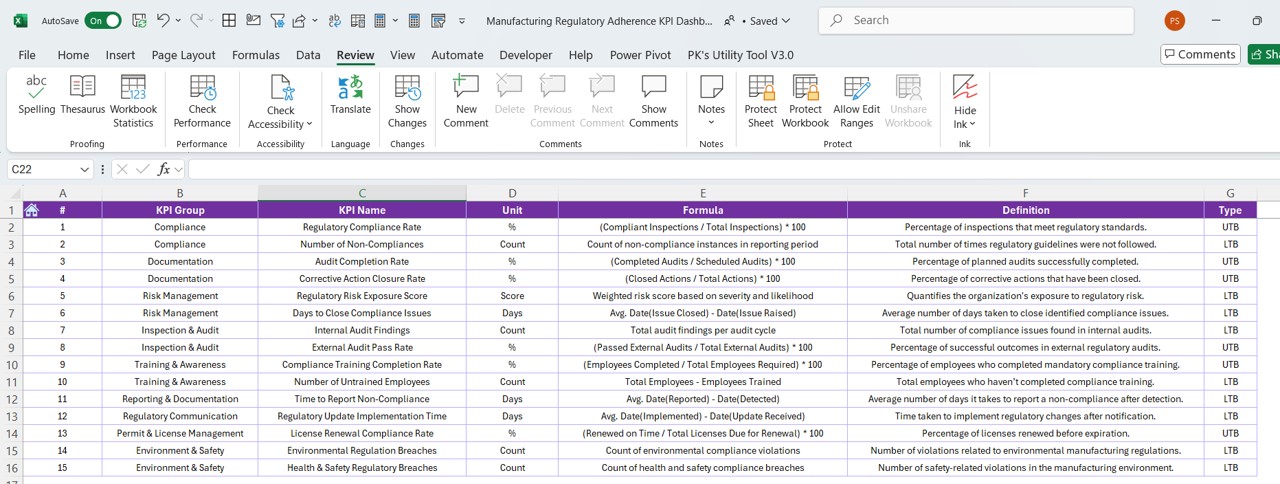
Maintain master data for:
- KPI Name
- Group
- Unit
- Formula
- Description
Advantages of Using a Regulatory Adherence KPI Dashboard
🔄 Real-Time Monitoring: Instant insights into MTD and YTD progress help you spot issues before they escalate.
🔍 Data-Driven Decision Making: Visual dashboards backed by clear data points empower managers to act smartly.
📊 Consistency Across Reporting: Standard templates ensure uniformity across departments and plants.
🔧 Customization: You can easily add or edit KPIs according to the specific needs of your regulatory framework.
✅ Audit Readiness: Keep records and trends always ready for internal or external audits.
Best Practices for Using the Manufacturing Regulatory Adherence KPI Dashboard
To make the most of this tool, follow these tried-and-tested tips:
- Update Data Regularly: Schedule monthly updates to feed accurate MTD and YTD numbers.
- Standardize KPI Definitions: Ensure every KPI has a clear, consistent definition for organization-wide understanding.
- Use Conditional Formatting Wisely: Keep the arrows and indicators meaningful. Red means alert, green means good—keep it intuitive.
- Automate Where Possible: Use formulas and dropdowns to minimize manual errors and speed up data entry.
- Train Your Team: Ensure every stakeholder knows how to use the dashboard effectively.
Conclusion
Manufacturing companies cannot afford to ignore compliance. But tracking dozens of regulatory metrics manually can lead to errors, delays, and miscommunication. That’s why the Manufacturing Regulatory Adherence KPI Dashboard in Excel becomes your best companion in staying compliant, efficient, and audit-ready.
It’s more than just a tracker—it’s your go-to dashboard for peace of mind and process improvement.
Frequently Asked Questions (FAQs)
Can I add more KPIs to the dashboard?
Yes, the dashboard is fully customizable. You can add more rows to the KPI Definition sheet and link them across the dashboard.
Is this dashboard suitable for all types of manufacturing?
Absolutely. Whether you are in food, automotive, textile, or pharma manufacturing, you can customize it based on the regulations applicable to your industry.
Does this dashboard work on Google Sheets?
It’s designed for Excel, but you can use it on Google Sheets with some formatting and formula adjustments.
Do I need any advanced Excel skills to use this?
No, the dashboard is beginner friendly. Dropdowns, charts, and sheets are all easy to navigate.
How often should I update the dashboard?
Monthly updates are recommended to keep MTD and YTD data accurate and meaningful.
Click to Purchase Manufacturing Regulatory Adherence KPI Dashboard in Excel
Visit our YouTube channel to learn step-by-step video tutorials