In the fast-paced world of manufacturing, keeping track of your revenue and performance metrics is crucial. Whether you run a small production unit or a large-scale factory, accurate tracking helps you make informed decisions, plan ahead, and optimize operations. That’s where the Manufacturing Revenue Tracking KPI Dashboard in Excel becomes a game-changer.
This article is your comprehensive, easy-to-understand guide to building and using a powerful KPI dashboard in Excel for tracking manufacturing revenue. From its key features to best practices and frequently asked questions, we’ve got everything covered. Let’s dive right in!
Click to Purchase Manufacturing Revenue Tracking KPI Dashboard in Excel
What Is a Manufacturing Revenue Tracking KPI Dashboard in Excel?
A Manufacturing Revenue Tracking KPI Dashboard is an Excel-based template that helps you monitor and analyze key performance indicators (KPIs) related to revenue. These KPIs include monthly revenue, targets, comparisons with previous years, and trends over time.
Instead of juggling scattered sheets, this dashboard pulls all the data into one place with charts, trend lines, and comparison visuals. It provides a bird’s-eye view of how your manufacturing business is performing.
Key Features of the Manufacturing Revenue Tracking KPI Dashboard
This dashboard comes packed with powerful and practical features. Here are the highlights:
Home Sheet – Your Navigation Hub
- Acts as an index page.
- Includes 6 clickable buttons to help you navigate to different sheets instantly.
- Clean and easy-to-understand layout.
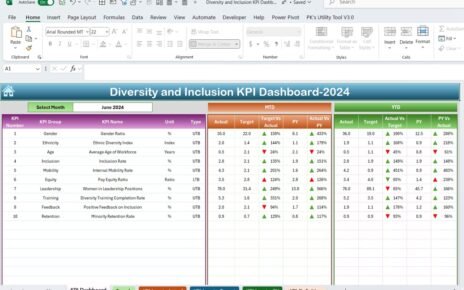
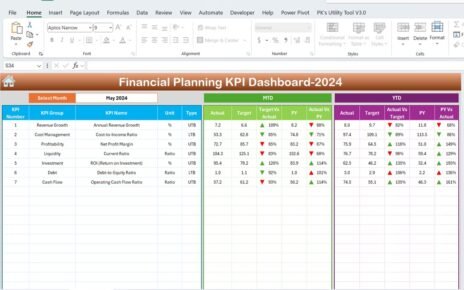
Dashboard Sheet Tab – The Main View
- Select the Month from a drop-down in cell D3.
- Instantly see updated MTD (Month-to-Date) and YTD (Year-to-Date) data.
Displays:
- MTD Actual, Target, and Previous Year.
- YTD Actual, Target, and Previous Year.
Includes conditional formatting with up/down arrows to show trends (Actual vs Target, Actual vs Previous Year).
KPI Trend Sheet – Deep Dive Into Trends
- Choose a KPI using a drop-down in cell C3.
Displays:
- KPI Group
- Unit of Measurement
- Type (Upper is better or Lower is better)
- Formula
- KPI Definition
Shows trend charts for MTD and YTD against Actual, Target, and PY data.
Actual Numbers Input Sheet
- Enter your actual monthly data here.
- Change the first month of the year from cell E1.
- Inputs for both MTD and YTD.
Target Sheet
- Enter monthly targets for each KPI.
- Includes both MTD and YTD targets.
Previous Year Number Sheet
- Record the previous year’s numbers similar to current year data entry.
KPI Definition Sheet
Enter detailed information about each KPI:
- KPI Name
- KPI Group
- Unit
- Formula
- Definition
Click to Purchase Manufacturing Revenue Tracking KPI Dashboard in Excel
Advantages of Using a Manufacturing Revenue Tracking KPI Dashboard
There are many reasons to use this type of dashboard. Some of the top advantages include:
✨ Real-time performance tracking with easy month selection.
🔢 Data accuracy through centralized data entry.
📉 Better decision-making using trend analysis and visual KPIs.
⏰ Time-saving template that reduces manual work.
🔄 Automatic calculations for MTD, YTD, and comparisons.
✏️ Customization options for KPIs as per your industry or organization.
🎓 Best Practices for the Manufacturing KPI Dashboard
To get the most out of your dashboard, follow these proven tips:
- Update Data Regularly: Make it a habit to input monthly actuals and targets. Consistency is key.
- Double-Check Your Inputs: Errors in input sheets can lead to inaccurate KPIs. Cross-check data before finalizing.
- Define KPIs Clearly: Every KPI should have a clear definition, formula, and goal (e.g., Upper is Better).
- Keep Formatting Simple: Stick with clean charts, clear fonts, and minimal colors to make interpretation easy.
- Use Conditional Formatting Wisely: Arrows and colors are useful, but avoid overloading visuals. Make trends clear, not cluttered.
Why Should You Use Excel for Revenue KPI Tracking?
Still wondering why Excel is the right tool for this? Here are some great reasons:
🔧 Flexibility: You can tweak formulas, add KPIs, or modify visuals easily.
🌐 Accessibility: Excel files can be shared and opened on most systems.
⚖️ Cost-Effective: No need for expensive software. Excel does it all!
🥇 Familiar Interface: Most users already know how Excel works.
💡 How to Use the Dashboard Effectively?
Using the dashboard is simple if you follow a step-by-step process:
- Start with the Home Sheet
- Use it to navigate easily.
- Go to the KPI Definition Sheet
- Set up your KPI names, formulas, and details.
- Enter Historical and Current Data
- Use the Actual Numbers, Target, and Previous Year sheets.
- View Your Dashboard
- Select the month in the Dashboard sheet to see auto-updated visuals.
- Explore Trends
- Use the KPI Trend sheet to study the performance deeply.
🌐 Who Can Use This Dashboard?
This dashboard template works for:
- Manufacturing Plant Managers
- Finance Teams
- Production Supervisors
- Data Analysts
- Small Business Owners
- Basically, anyone who tracks manufacturing revenue can benefit from it!
🔍 What KPIs Can You Track in This Dashboard?
- You can track KPIs like:
- Monthly Revenue
- On-Time Delivery Rate
- Production Cost per Unit
- Machine Downtime Cost
- Rework Costs
- Profit Margin
- Order Fulfillment Rate
- Sales vs Target
- And the list can go on based on your specific business goals.
🚀 Customization Ideas for Advanced Users
- Want to go beyond the basics? Try these customization ideas:
- Add a slicer for product categories or regions.
- Create dynamic charts using Pivot Tables.
- Add benchmarking data to compare with industry standards.
- Integrate with Power Query for automated data pulls.
📃 Frequently Asked Questions (FAQs)
Q1: Can I add more KPIs to this dashboard?
Yes. You can add as many KPIs as your business needs. Just make sure you update all related sheets.
Q2: Do I need Excel 365 for this template?
No. The dashboard works with Excel 2016 and above. However, Excel 365 offers better visuals and performance.
Q3: What if I want to track weekly data instead of monthly?
You can tweak the template by adjusting formulas and input ranges. Use week numbers instead of months.
Q4: Is this dashboard beginner-friendly?
Absolutely! We designed it with simplicity in mind. All sections are labeled, and drop-downs guide you.
Q5: Can I use this template for non-manufacturing revenue tracking?
Yes, with slight edits. Just rename the KPIs and adjust formulas according to your industry.
Click to Purchase Manufacturing Revenue Tracking KPI Dashboard in Excel
Visit our YouTube channel to learn step-by-step video tutorials